1) Treatment group n₁ = 50 x1 = 7.00 Placebo group S₁ = 1.00 n2 = 100 x2 = 6.00 S2 = 2.00 Test the claim that the two samples come from populations with the same mean. Use a = .05. Draw it: Conclusion (full sentence): Ho= HA= Calculated vale p-value Decision Find the 95% confidence interval for the difference between the two population means to the nearest hundredth.
1) Treatment group n₁ = 50 x1 = 7.00 Placebo group S₁ = 1.00 n2 = 100 x2 = 6.00 S2 = 2.00 Test the claim that the two samples come from populations with the same mean. Use a = .05. Draw it: Conclusion (full sentence): Ho= HA= Calculated vale p-value Decision Find the 95% confidence interval for the difference between the two population means to the nearest hundredth.

MATLAB: An Introduction with Applications
6th Edition
ISBN:9781119256830
Author:Amos Gilat
Publisher:Amos Gilat
Chapter1: Starting With Matlab
Section: Chapter Questions
Problem 1P

Related questions
Question
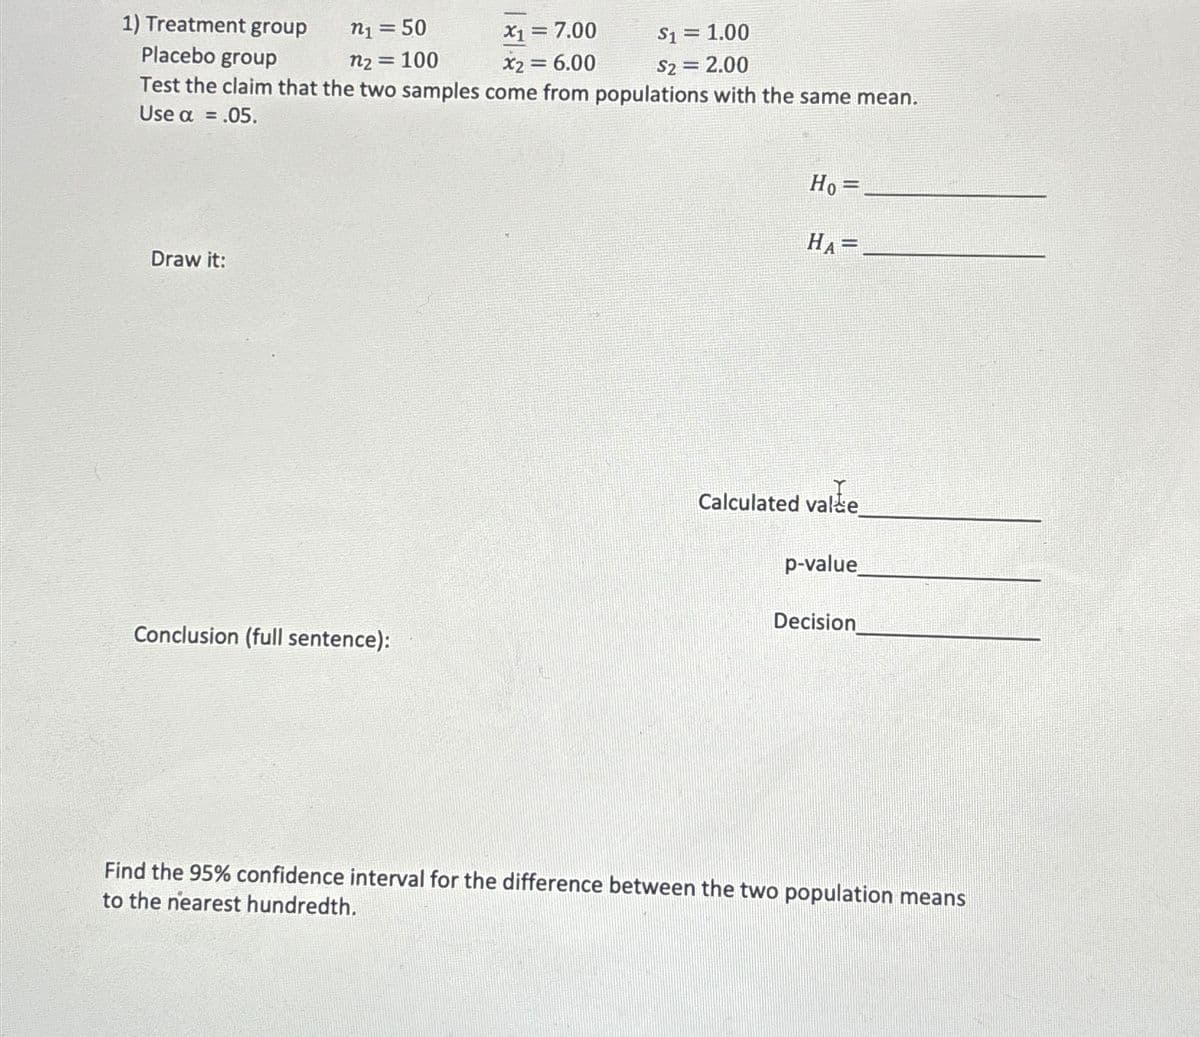
Transcribed Image Text:1) Treatment group
n₁ = 50
x1 = 7.00
Placebo group
S₁ = 1.00
n2 = 100
x2 = 6.00
S2 = 2.00
Test the claim that the two samples come from populations with the same mean.
Use a = .05.
Draw it:
Conclusion (full sentence):
Ho=
HA=
Calculated vale
p-value
Decision
Find the 95% confidence interval for the difference between the two population means
to the nearest hundredth.
AI-Generated Solution

Unlock instant AI solutions
Tap the button
to generate a solution
Recommended textbooks for you
MATLAB: An Introduction with Applications
Statistics
ISBN:
9781119256830
Author:
Amos Gilat
Publisher:
John Wiley & Sons Inc

Probability and Statistics for Engineering and th…
Statistics
ISBN:
9781305251809
Author:
Jay L. Devore
Publisher:
Cengage Learning

Statistics for The Behavioral Sciences (MindTap C…
Statistics
ISBN:
9781305504912
Author:
Frederick J Gravetter, Larry B. Wallnau
Publisher:
Cengage Learning
MATLAB: An Introduction with Applications
Statistics
ISBN:
9781119256830
Author:
Amos Gilat
Publisher:
John Wiley & Sons Inc
Probability and Statistics for Engineering and th…
Statistics
ISBN:
9781305251809
Author:
Jay L. Devore
Publisher:
Cengage Learning
Statistics for The Behavioral Sciences (MindTap C…
Statistics
ISBN:
9781305504912
Author:
Frederick J Gravetter, Larry B. Wallnau
Publisher:
Cengage Learning

Elementary Statistics: Picturing the World (7th E…
Statistics
ISBN:
9780134683416
Author:
Ron Larson, Betsy Farber
Publisher:
PEARSON

The Basic Practice of Statistics
Statistics
ISBN:
9781319042578
Author:
David S. Moore, William I. Notz, Michael A. Fligner
Publisher:
W. H. Freeman

Introduction to the Practice of Statistics
Statistics
ISBN:
9781319013387
Author:
David S. Moore, George P. McCabe, Bruce A. Craig
Publisher:
W. H. Freeman