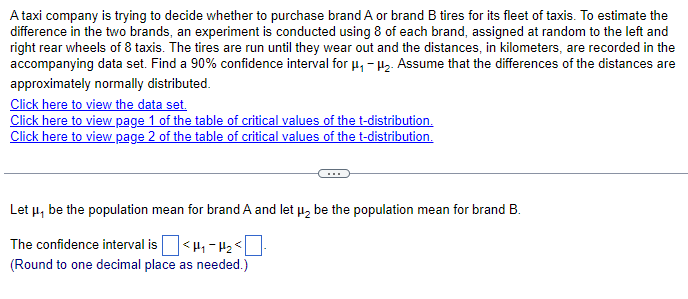
A taxi company is trying to decide whether to purchase brand A or brand B tires for its fleet of taxis. To estimate the difference in the two brands, an experiment is conducted using 8 of each brand, assigned at random to the left and right rear wheels of 8 taxis. The tires are run until they wear out and the distances, in kilometers, are recorded in the accompanying data set. Find a 90% confidence interval for μ₁-μ₂. Assume that the differences of the distances are approximately normally distributed. Click here to view the data set. Click here to view page 1 of the table of critical values of the t-distribution. Click here to view page 2 of the table of critical values of the t-distribution. Let μ, be the population mean for brand A and let μ₂ be the population mean for brand B. The confidence interval is
A taxi company is trying to decide whether to purchase brand A or brand B tires for its fleet of taxis. To estimate the difference in the two brands, an experiment is conducted using 8 of each brand, assigned at random to the left and right rear wheels of 8 taxis. The tires are run until they wear out and the distances, in kilometers, are recorded in the accompanying data set. Find a 90% confidence interval for μ₁-μ₂. Assume that the differences of the distances are approximately normally distributed. Click here to view the data set. Click here to view page 1 of the table of critical values of the t-distribution. Click here to view page 2 of the table of critical values of the t-distribution. Let μ, be the population mean for brand A and let μ₂ be the population mean for brand B. The confidence interval is

MATLAB: An Introduction with Applications
6th Edition
ISBN:9781119256830
Author:Amos Gilat
Publisher:Amos Gilat
Chapter1: Starting With Matlab
Section: Chapter Questions
Problem 1P

Related questions
Question
100%
Taxi Brand A Brand B
1 41,200 42,700
2 31,100 31,200
3 43,600 44,600
4 42,600 40,900
5 41,400 41,100
6 35,600 40,200
7 47,000 48,200
8 40,200 41,400
Transcribed Image Text:A taxi company is trying to decide whether to purchase brand A or brand B tires for its fleet of taxis. To estimate the
difference in the two brands, an experiment is conducted using 8 of each brand, assigned at random to the left and
right rear wheels of 8 taxis. The tires are run until they wear out and the distances, in kilometers, are recorded in the
accompanying data set. Find a 90% confidence interval for μ₁- H₂. Assume that the differences of the distances are
approximately normally distributed.
Click here to view the data set.
Click here to view page 1 of the table of critical values of the t-distribution.
Click here to view page 2 of the table of critical values of the t-distribution.
Let μ, be the population mean for brand A and let μ₂ be the population mean for brand B.
The confidence interval is ☐ <μ₁₂<☐
(Round to one decimal place as needed.)
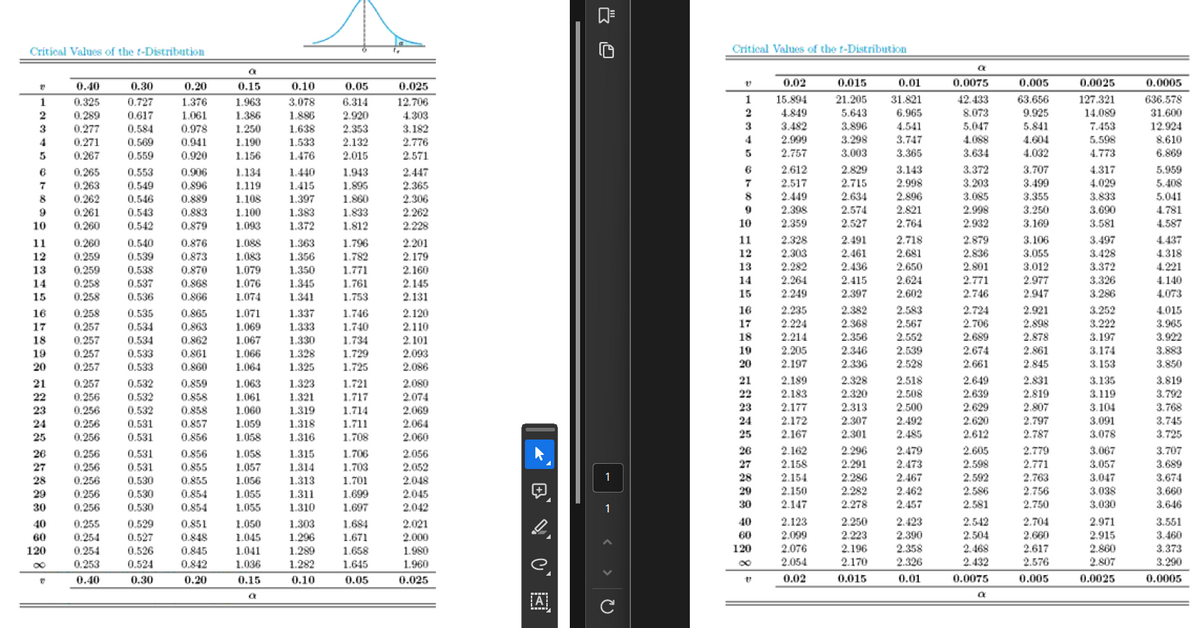
Transcribed Image Text:Critical Values of the t-Distribution
Critical Values of the t-Distribution
a
a
0.40
0.30
0.20
0.15
0.10
0.05
0.025
0.02
0.015
0.01
0.0075
0.005
0.0025
0.0005
1
0.325
0.727
1.376
1.963
3.078
6.314
12.706
1
15.894
21.205
31.821
42.433
63.656
127.321
636.578
2
0.289
0.617
1.061
1.386
1.886
2.920
4.303
2
4.849
5.643
6.965
8.073
9.925
14.089
31.600
3
0.277
0.584
0.978
1.250
1.638
2.353
3.182
3
3.482
3.896
4.541
5.047
5.841
7.453
12.924
4
0.271
0.569
0.941
1.190
1.533
2.132
2.776
4
2.999
3.298
3.747
4.088
4.604
5.598
8.610
5
0.267
0.559
0.920
1.156
1.476
2.015
2.571
5
2.757
3.003
3.365
3.634
4.032
4.773
6.869
в
0.265
0.553
0.906
1.134
1.440
1.943
2.447
6
2.612
2.829
3.143
3.372
3.707
4.317
5.959
7
0.263
0.549
0.896
1.119
1.415
1.895
2.365
7
2.517
2.715
2.998
3.203
3.499
4.029
5.408
8
0.262
0.546
0.889
1.108
1.397
1.860
2.306
8
2.449
2.634
2.896
3.085
3.355
3.833
5.041
9
0.261
0.543
0.883
1.100
1.383
1.833
2.262
9
2.398
2.574
2.821
2.998
3.250
3.690
4.781
10
0.260
0.542
0.879
1.093
1.372
1.812
2.228
10
2.359
2.527
2.764
2.932
3.169
3.581
4.587
11
0.260
0.540
0.876
1.088
1.363
1.796
2.201
11
2.328
2.491
2.718
2.879
3.106
3.497
4.437
12
0.259
0.539
0.873
1.083
1.356
1.782
2.179
12
2.303
2.461
2.681
2.836
3.055
3.428
4.318
13
0.259
0.538
0.870
1.079
1.350
1.771
2.160
13
2.282
2.436
2.650
2.801
3.012
3.372
4.221
14
0.258
0.537
0.868
1.076
1.345
1.761
2.145
14
2.264
2.415
2.624
2.771
2.977
3.326
4.140
15
0.258
0.536
0.866
1.074
1.341
1.753
2.131
15
2.249
2.397
2.602
2.746
2.947
3.286
4.073
16
0.258
0.535
0.865
1.071
1.337
1.746
2.120
16
2.235
2.382
2.583
2.724
2.921
3.252
4.015
17
0.257
0.534
0.863
1.069
1.333
1.740
2.110
17
2.224
2.368
2.567
2.706
2.898
3.222
3.965
18
0.257
0.534
0.862
1.067
1.330
1.734
2.101
18
2.214
2.356
2.552
2.689
2.878
3.197
3.922
19
0.257
0.533
0.861
1.066
1.328
1.729
2.093
2.205
2.346
2.539
2.674
2.861
3.174
3.883
20
0.257
0.533
0.860
1.064
1.325
1.725
2.086
20
2.197
2.336
2.528
2.661
2.845
3.153
3.850
21
0.257
0.532
0.859
1.063
1.323
1.721
2.080
21
2.189
2.328
2.518
2.649
2.831
3.135
3.819
22
0.256
0.532
0.858
1.061
1.321
1.717
2.074
22
2.183
2.320
2.508
2.639
2.819
3.119
3.792
23
0.256
0.532
0.858
1.060
1.319
1.714
2.069
23
2.177
2.313
2.500
2.629
2.807
3.104
3.768
24
0.256
0.531
0.857
1.059
1.318
1.711
2.064
24
2.172
2.307
2.492
2.620
2.797
3.091
3.745
25
0.256
0.531
0.856
1.058
1.316
1.708
2.060
25
2.167
2.301
2.485
2.612
2.787
3.078
3.725
26
0.256
0.531
0.856
1.058
1.315
1.706
2.056
27
0.256
0.531
0.855
1.057
1.314
1.703
2.052
28
0.256
0.530
0.855
1.056
1.313
1.701
2.048
-
29
0.256
0.530
0.854
1.055
1.311
1.699
2.045
30
0.256
0.530
0.854
1.055
1.310
1.697
2.042
40
0.255
0.529
0.851
1.050
1.303
1.684
2.021
60
0.254
0.527
0.848
1.045
1.296
1.671
2.000
120
0.254
0.526
0.845
1.041
1.289
1.658
1.980
8"
0.253
0.524
0.842
1.036
1.282
1.645
1.960
e
0.40
0.30
0.20
0.15
0.10
- <>
120
888 988
26
2.162
2.296
2.479
2.605
2.779
3.067
3.707
27
2.158
2.291
2.473
2.598
2.771
3.057
3.689
28
2.154
2.286
2.467
2.592
2.763
3.047
3.674
2.150
2.282
2.462
2.586
2.756
3.038
3.660
30
2.147
2.278
2.457
2.581
2.750
3.030
3.646
40
2.123
2.250
2.423
2.542
2.704
2.971
3.551
60
2.099
2.223
2.390
2.504
2.660
2.915
3.460
2.076
2.196
2.358
2.468
2.617
2.860
3.373
2.054
2.170
2.326
2.432
2.576
2.807
3.290
0.05
0.025
0.02
0.015
0.01
0.0075
0.005
0.0025
0.0005
a
A
a
C
Expert Solution
This question has been solved!
Explore an expertly crafted, step-by-step solution for a thorough understanding of key concepts.

Step by step
Solved in 3 steps with 17 images

Recommended textbooks for you
MATLAB: An Introduction with Applications
Statistics
ISBN:
9781119256830
Author:
Amos Gilat
Publisher:
John Wiley & Sons Inc

Probability and Statistics for Engineering and th…
Statistics
ISBN:
9781305251809
Author:
Jay L. Devore
Publisher:
Cengage Learning

Statistics for The Behavioral Sciences (MindTap C…
Statistics
ISBN:
9781305504912
Author:
Frederick J Gravetter, Larry B. Wallnau
Publisher:
Cengage Learning
MATLAB: An Introduction with Applications
Statistics
ISBN:
9781119256830
Author:
Amos Gilat
Publisher:
John Wiley & Sons Inc
Probability and Statistics for Engineering and th…
Statistics
ISBN:
9781305251809
Author:
Jay L. Devore
Publisher:
Cengage Learning
Statistics for The Behavioral Sciences (MindTap C…
Statistics
ISBN:
9781305504912
Author:
Frederick J Gravetter, Larry B. Wallnau
Publisher:
Cengage Learning

Elementary Statistics: Picturing the World (7th E…
Statistics
ISBN:
9780134683416
Author:
Ron Larson, Betsy Farber
Publisher:
PEARSON

The Basic Practice of Statistics
Statistics
ISBN:
9781319042578
Author:
David S. Moore, William I. Notz, Michael A. Fligner
Publisher:
W. H. Freeman

Introduction to the Practice of Statistics
Statistics
ISBN:
9781319013387
Author:
David S. Moore, George P. McCabe, Bruce A. Craig
Publisher:
W. H. Freeman