A variable is normally distributed with mean 8 and standard deviation 2. a. Find the percentage of all possible values of the variable that lie between 3 and 10. b. Find the percentage of all possible values of the variable that exceed 4. c. Find the percentage of all possible values of the variable that are less than 6. Click here to view page 1 of the standard normai table. Click here to view page 2 of the standard normal table. a. The percentage of all possible values of the variable that lie between 3 and 10 is %. (Round to two decimal places as needed.) b. The percentage of all possible values of the variable that exceed 4 is (Round to two decimal places as needed.) 1%- c. The percentage of all possible values of the variable that are less than 6 is %. (Round to two decimal places as needed.)
A variable is normally distributed with mean 8 and standard deviation 2. a. Find the percentage of all possible values of the variable that lie between 3 and 10. b. Find the percentage of all possible values of the variable that exceed 4. c. Find the percentage of all possible values of the variable that are less than 6. Click here to view page 1 of the standard normai table. Click here to view page 2 of the standard normal table. a. The percentage of all possible values of the variable that lie between 3 and 10 is %. (Round to two decimal places as needed.) b. The percentage of all possible values of the variable that exceed 4 is (Round to two decimal places as needed.) 1%- c. The percentage of all possible values of the variable that are less than 6 is %. (Round to two decimal places as needed.)

MATLAB: An Introduction with Applications
6th Edition
ISBN:9781119256830
Author:Amos Gilat
Publisher:Amos Gilat
Chapter1: Starting With Matlab
Section: Chapter Questions
Problem 1P

Related questions
Question
Please help part c please
Transcribed Image Text:+
5
K
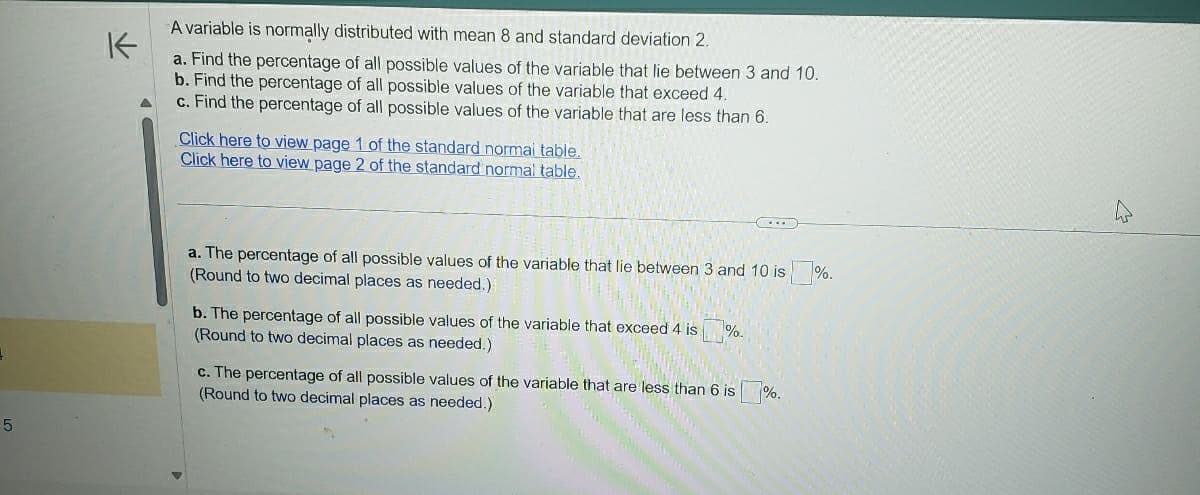
A variable is normally distributed with mean 8 and standard deviation 2.
a. Find the percentage of all possible values of the variable that lie between 3 and 10.
b. Find the percentage of all possible values of the variable that exceed 4.
c. Find the percentage of all possible values of the variable that are less than 6.
Click here to view page 1 of the standard normal table.
Click here to view page 2 of the standard normal table.
a. The percentage of all possible values of the variable that lie between 3 and 10 is
(Round to two decimal places as needed.)
b. The percentage of all possible values of the variable that exceed 4 is
(Round to two decimal places as needed.)
%-
c. The percentage of all possible values of the variable that are less than 6 is %.
(Round to two decimal places as needed.)
%.
Expert Solution
This question has been solved!
Explore an expertly crafted, step-by-step solution for a thorough understanding of key concepts.

This is a popular solution!

Trending now
This is a popular solution!

Step by step
Solved in 3 steps with 7 images

Recommended textbooks for you
MATLAB: An Introduction with Applications
Statistics
ISBN:
9781119256830
Author:
Amos Gilat
Publisher:
John Wiley & Sons Inc

Probability and Statistics for Engineering and th…
Statistics
ISBN:
9781305251809
Author:
Jay L. Devore
Publisher:
Cengage Learning

Statistics for The Behavioral Sciences (MindTap C…
Statistics
ISBN:
9781305504912
Author:
Frederick J Gravetter, Larry B. Wallnau
Publisher:
Cengage Learning
MATLAB: An Introduction with Applications
Statistics
ISBN:
9781119256830
Author:
Amos Gilat
Publisher:
John Wiley & Sons Inc
Probability and Statistics for Engineering and th…
Statistics
ISBN:
9781305251809
Author:
Jay L. Devore
Publisher:
Cengage Learning
Statistics for The Behavioral Sciences (MindTap C…
Statistics
ISBN:
9781305504912
Author:
Frederick J Gravetter, Larry B. Wallnau
Publisher:
Cengage Learning

Elementary Statistics: Picturing the World (7th E…
Statistics
ISBN:
9780134683416
Author:
Ron Larson, Betsy Farber
Publisher:
PEARSON

The Basic Practice of Statistics
Statistics
ISBN:
9781319042578
Author:
David S. Moore, William I. Notz, Michael A. Fligner
Publisher:
W. H. Freeman

Introduction to the Practice of Statistics
Statistics
ISBN:
9781319013387
Author:
David S. Moore, George P. McCabe, Bruce A. Craig
Publisher:
W. H. Freeman