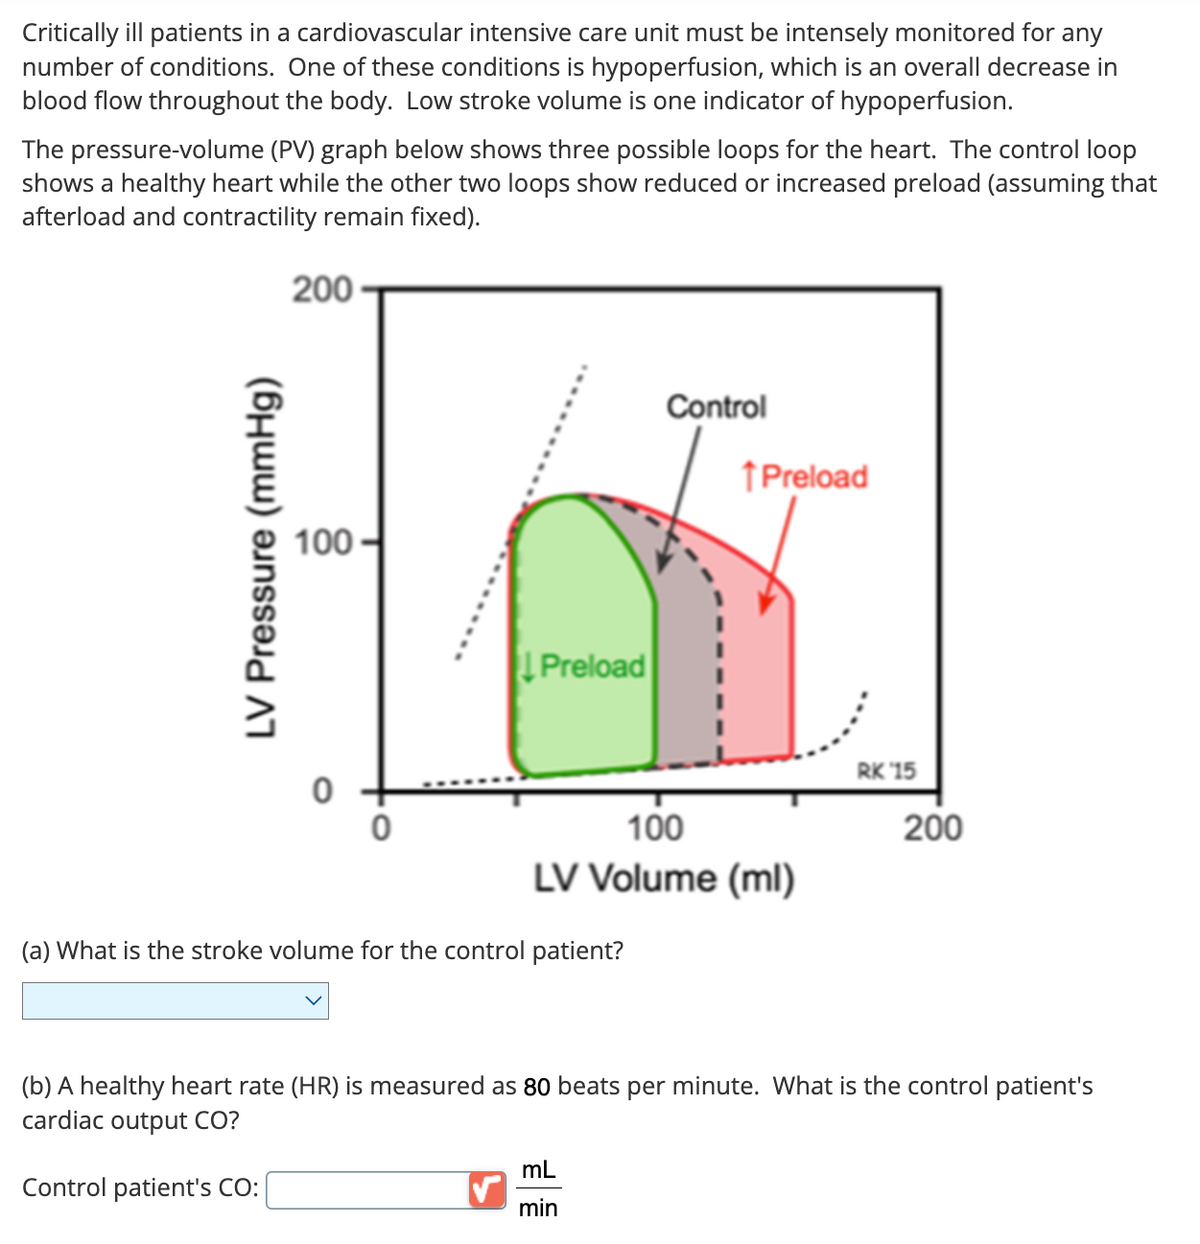
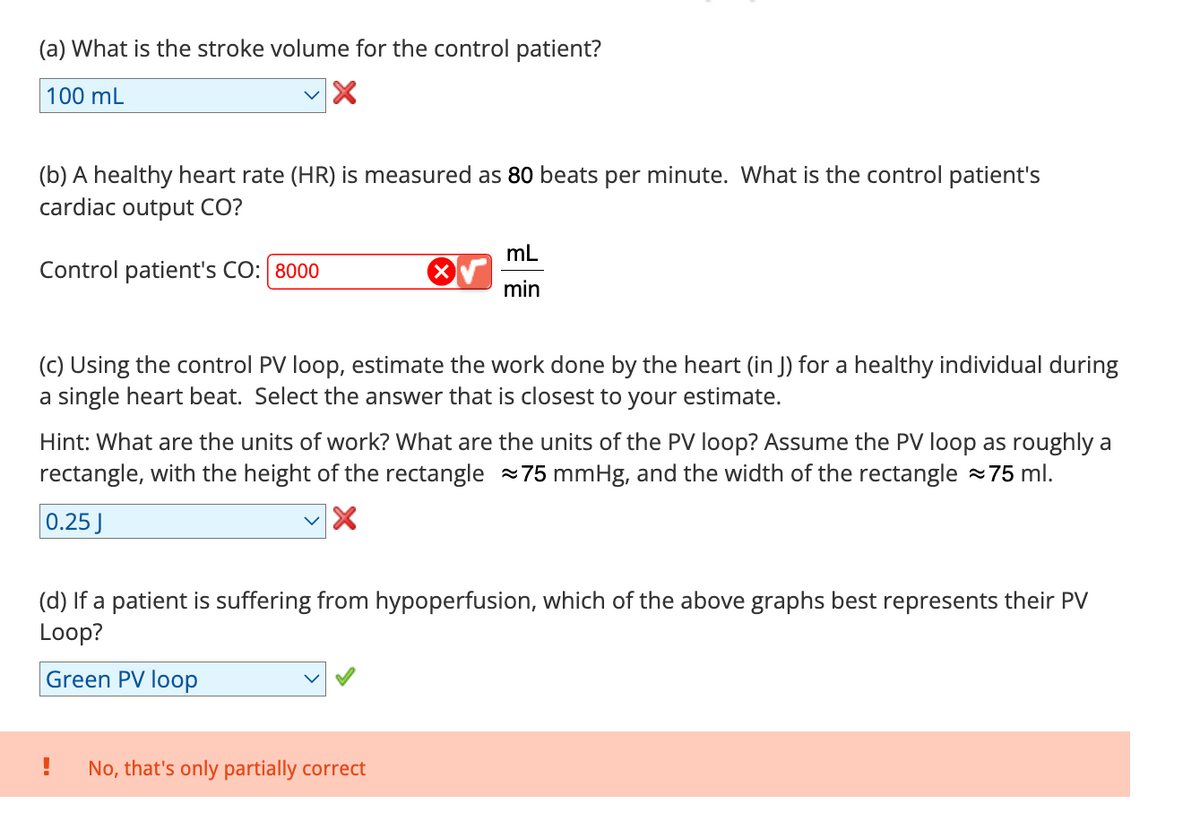
(a) What is the stroke volume for the control patient? 100 mL (b) A healthy heart rate (HR) is measured as 80 beats per minute. What is the control patient's cardiac output CO? Control patient's CO: 8000 mL min (c) Using the control PV loop, estimate the work done by the heart (in J) for a healthy individual during a single heart beat. Select the answer that is closest to your estimate. Hint: What are the units of work? What are the units of the PV loop? Assume the PV loop as roughly a rectangle, with the height of the rectangle 75 mmHg, and the width of the rectangle ~75 ml. 0.25J (d) If a patient is suffering from hypoperfusion, which of the above graphs best represents their PV Loop? Green PV loop
(a) What is the stroke volume for the control patient? 100 mL (b) A healthy heart rate (HR) is measured as 80 beats per minute. What is the control patient's cardiac output CO? Control patient's CO: 8000 mL min (c) Using the control PV loop, estimate the work done by the heart (in J) for a healthy individual during a single heart beat. Select the answer that is closest to your estimate. Hint: What are the units of work? What are the units of the PV loop? Assume the PV loop as roughly a rectangle, with the height of the rectangle 75 mmHg, and the width of the rectangle ~75 ml. 0.25J (d) If a patient is suffering from hypoperfusion, which of the above graphs best represents their PV Loop? Green PV loop
Related questions
Question

Transcribed Image Text:Critically ill patients in a cardiovascular intensive care unit must be intensely monitored for any
number of conditions. One of these conditions is hypoperfusion, which is an overall decrease in
blood flow throughout the body. Low stroke volume is one indicator of hypoperfusion.
The pressure-volume (PV) graph below shows three possible loops for the heart. The control loop
shows a healthy heart while the other two loops show reduced or increased preload (assuming that
afterload and contractility remain fixed).
200
LV Pressure (mmHg)
100
Preload
Control
↑ Preload
100
LV Volume (ml)
(a) What is the stroke volume for the control patient?
RK '15
200
(b) A healthy heart rate (HR) is measured as 80 beats per minute. What is the control patient's
cardiac output CO?
Control patient's CO:
mL
min

Transcribed Image Text:(a) What is the stroke volume for the control patient?
100 mL
(b) A healthy heart rate (HR) is measured as 80 beats per minute. What is the control patient's
cardiac output CO?
Control patient's CO: 8000
mL
min
(c) Using the control PV loop, estimate the work done by the heart (in J) for a healthy individual during
a single heart beat. Select the answer that is closest to your estimate.
Hint: What are the units of work? What are the units of the PV loop? Assume the PV loop as roughly a
rectangle, with the height of the rectangle 75 mmHg, and the width of the rectangle ~75 ml.
0.25 J
(d) If a patient is suffering from hypoperfusion, which of the above graphs best represents their PV
Loop?
Green PV loop
No, that's only partially correct
Expert Solution
This question has been solved!
Explore an expertly crafted, step-by-step solution for a thorough understanding of key concepts.
Step by step
Solved in 4 steps
