import matplotlib.pyplot as plt import numpy as np theta = np.linspace (0,2*np.pi, 100) fig, axes = plt.subplots(1,3) axes.axis('off') axes.set_aspect('equal') xylim = (-10,10) axes.set_xlim(xylim) axes.set_ylim(xylim) for i in range(-11, 11, 3): axes.axvline(x=i, color='gray', alpha=0.5) axes.axhline(y=i, color='gray', alpha=0.5) def koncentriske_circler(r, x0=0, y0=0): x=rnp.cos(theta) y = r * np.sin(theta) return x+x0, y+y0 def create_peripheral_circles(ax, N, radius_main_circle, radius_sub_circles): angle_step = 2 × np.pi / N for i in range(N) : b = 10 a = 3 angle = i * angle_step x = radius_main_circle * np.cos(angle) y = radius_main_circle ✶ np.sin(angle) circle = plt.Circle((x, y), radius_sub_circles, color='r') ax.add_artist (circle) c = (b-a)/2 r = [b, a] colors = [(1, 0, 0, 0.3), ('C1'), ('C1')] N_values = [3, 5, 8] for i, colors, N_value in zip(r, colors, N_values): x, y = koncentriske_circler(i, 0, 0) axes.plot(x, y) axes.fill(x, y, color=colors) create_peripheral_circles (axes, N_value, (a+c), c) plt.show() 10- -10- -10
import matplotlib.pyplot as plt import numpy as np theta = np.linspace (0,2*np.pi, 100) fig, axes = plt.subplots(1,3) axes.axis('off') axes.set_aspect('equal') xylim = (-10,10) axes.set_xlim(xylim) axes.set_ylim(xylim) for i in range(-11, 11, 3): axes.axvline(x=i, color='gray', alpha=0.5) axes.axhline(y=i, color='gray', alpha=0.5) def koncentriske_circler(r, x0=0, y0=0): x=rnp.cos(theta) y = r * np.sin(theta) return x+x0, y+y0 def create_peripheral_circles(ax, N, radius_main_circle, radius_sub_circles): angle_step = 2 × np.pi / N for i in range(N) : b = 10 a = 3 angle = i * angle_step x = radius_main_circle * np.cos(angle) y = radius_main_circle ✶ np.sin(angle) circle = plt.Circle((x, y), radius_sub_circles, color='r') ax.add_artist (circle) c = (b-a)/2 r = [b, a] colors = [(1, 0, 0, 0.3), ('C1'), ('C1')] N_values = [3, 5, 8] for i, colors, N_value in zip(r, colors, N_values): x, y = koncentriske_circler(i, 0, 0) axes.plot(x, y) axes.fill(x, y, color=colors) create_peripheral_circles (axes, N_value, (a+c), c) plt.show() 10- -10- -10

New Perspectives on HTML5, CSS3, and JavaScript
6th Edition
ISBN:9781305503922
Author:Patrick M. Carey
Publisher:Patrick M. Carey
Chapter9: Getting Started With Javascript: Creating A Countdown Clock
Section: Chapter Questions
Problem 16CP1

Related questions
Question
The original question:
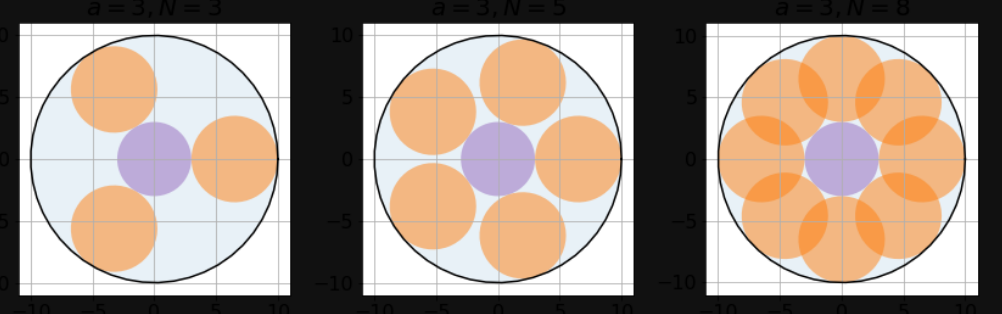
Let the two concentric circles have radius a and b respectively. Let the radius of the N circles be c. If you know the values for a and b, the value of c follows. Derive an expression for c when a and b are known. Make an overall figure where you plot for a=3, b=10 and N being 3, 5 and 8.
I have attempted to write a script that works, but I can't get it to work. If you could help me figure out what I'm missing, that would be great. I have attached an image of what the plot should look like, and an image of my code
![import matplotlib.pyplot as plt
import numpy as np
theta = np.linspace (0,2*np.pi, 100)
fig, axes = plt.subplots(1,3)
axes.axis('off')
axes.set_aspect('equal')
xylim = (-10,10)
axes.set_xlim(xylim)
axes.set_ylim(xylim)
for i in range(-11, 11, 3):
axes.axvline(x=i, color='gray', alpha=0.5)
axes.axhline(y=i, color='gray', alpha=0.5)
def koncentriske_circler(r, x0=0, y0=0):
x=rnp.cos(theta)
y = r * np.sin(theta)
return x+x0, y+y0
def create_peripheral_circles(ax, N, radius_main_circle, radius_sub_circles):
angle_step = 2 × np.pi / N
for i in range(N) :
b = 10
a = 3
angle = i * angle_step
x = radius_main_circle * np.cos(angle)
y = radius_main_circle ✶ np.sin(angle)
circle = plt.Circle((x, y), radius_sub_circles, color='r')
ax.add_artist (circle)
c = (b-a)/2
r = [b, a]
colors = [(1, 0, 0, 0.3), ('C1'), ('C1')]
N_values = [3, 5, 8]
for i, colors, N_value in zip(r, colors, N_values):
x, y = koncentriske_circler(i, 0, 0)
axes.plot(x, y)
axes.fill(x, y, color=colors)
create_peripheral_circles (axes, N_value, (a+c), c)
plt.show()](/v2/_next/image?url=https%3A%2F%2Fcontent.bartleby.com%2Fqna-images%2Fquestion%2F6494d579-1e69-4455-8126-d28019ee37d8%2F6b31721d-e4bc-467c-b044-331805a1a541%2Fnbhj6pt_processed.png&w=3840&q=75)
Transcribed Image Text:import matplotlib.pyplot as plt
import numpy as np
theta = np.linspace (0,2*np.pi, 100)
fig, axes = plt.subplots(1,3)
axes.axis('off')
axes.set_aspect('equal')
xylim = (-10,10)
axes.set_xlim(xylim)
axes.set_ylim(xylim)
for i in range(-11, 11, 3):
axes.axvline(x=i, color='gray', alpha=0.5)
axes.axhline(y=i, color='gray', alpha=0.5)
def koncentriske_circler(r, x0=0, y0=0):
x=rnp.cos(theta)
y = r * np.sin(theta)
return x+x0, y+y0
def create_peripheral_circles(ax, N, radius_main_circle, radius_sub_circles):
angle_step = 2 × np.pi / N
for i in range(N) :
b = 10
a = 3
angle = i * angle_step
x = radius_main_circle * np.cos(angle)
y = radius_main_circle ✶ np.sin(angle)
circle = plt.Circle((x, y), radius_sub_circles, color='r')
ax.add_artist (circle)
c = (b-a)/2
r = [b, a]
colors = [(1, 0, 0, 0.3), ('C1'), ('C1')]
N_values = [3, 5, 8]
for i, colors, N_value in zip(r, colors, N_values):
x, y = koncentriske_circler(i, 0, 0)
axes.plot(x, y)
axes.fill(x, y, color=colors)
create_peripheral_circles (axes, N_value, (a+c), c)
plt.show()
Transcribed Image Text:10-
-10-
-10
AI-Generated Solution

Unlock instant AI solutions
Tap the button
to generate a solution
Recommended textbooks for you
New Perspectives on HTML5, CSS3, and JavaScript
Computer Science
ISBN:
9781305503922
Author:
Patrick M. Carey
Publisher:
Cengage Learning
New Perspectives on HTML5, CSS3, and JavaScript
Computer Science
ISBN:
9781305503922
Author:
Patrick M. Carey
Publisher:
Cengage Learning