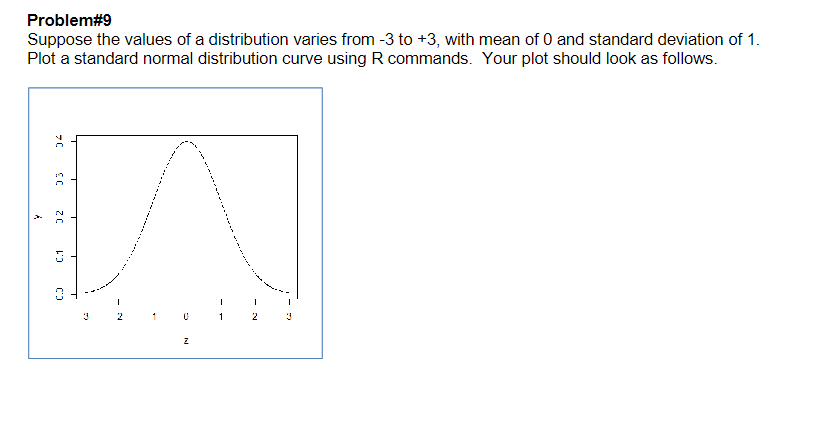
Problem#9 Suppose the values of a distribution varies from -3 to +3, with mean of 0 and standard deviation of 1. Plot a standard normal distribution curve using R commands. Your plot should look as follows. A 70 33 ZC C.1 0.3 3 1 z


Q: Is there anything more you can think of that Apple could do to fix the temperature, storage, and…
A: As technology continues to evolve, companies like Apple strive to improve their products and…
Q: Which characteristics of time-sharing and distributed system operating systems are distinct from one…
A: An operating system is a tool for dealing with hardware. An interface that enables complete system…
Q: Why is it essential for a computer to have a central processing unit (CPU)? What are your opinions?
A: First, a computer requires a central processing unit (CPU) because it provides the processing…
Q: Write a complete C++ program that asks the user to input information for at least 10 students. Use…
A: 1. Begin. 2. Define a structure 'Student' with the data members' name, matricNo, courseNo, and…
Q: Tunnels are created via point-to-point transport layer protocols.
A: Tunneling: In the real world, tunneling is a technique for navigating obstacles that would…
Q: Take, for example, the issue that occurs when the operating system of a computer uses a number of…
A: An operating system is a collection of software that manages computer hardware resources and…
Q: I need help explaining each and every line of the code functionality…
A: We need to explain each and every line of the code functionality
Q: Ben & Jerry's has developed a microservice-oriented accounting application consisting of various…
A: Microservices are a software development approach where an application is broken down into small,…
Q: There is more than one way to calculate the value of T. One way that this can be done is by…
A: Start. Set the number of iterations to 1000. Initialize variables: num_points_in_circle and…
Q: Describe the running time in terms of the variable n. it would be better to say That loop will run…
A: We can see that the while loop is there in the code. i must equal n in order for the loop to be…
Q: The point-to-point transport layer protocols of a network are the ones responsible for both the…
A: Point-to-point transport layer protocols are a type of communication protocol that makes it easier…
Q: d P(S|~C)=0.5 -- R is conditional on C, with P(R|C)=0.8, and P(R|~C)=0.2 -- W is conditional on S…
A: A Bayesian network is a graphical model that represents a set of variables and their probabilistic…
Q: ou should enters a number that is outside the range of 1 through 7.
A: The problem asks us to write a Python program that prompts the user for a number between 1 and 7 and…
Q: Imagine a class called "Course" with two attributes: Course ID and CourseName. A) Describe the…
A: In this question we have to explain the process of creating a Java application that implements CRUD…
Q: This article thoroughly explores cyberbullying, including its causes, effects on society, and…
A: 1) Cyberbullying refers to the use of technology, such as the internet, social media, and mobile…
Q: str is a String object. Write Java statements that prints the characters of str with index…
A: The Java code snippet that prints the characters of a String object str with index increments of 3…
Q: Design and implement a set of classes that define a series of threedimensional geometric shapes. For…
A: The Shape3D class serves as a base class for all 3D shapes, and defines a name attribute and methods…
Q: y(t) = 01 + 02x(t) + O3x² (t) + O4x*(t) + 0sx* (t) + O6x*(t) +0,x°(t) Solve tjro matlab.
A: The problem requires us to generate pairs of data (x, y) using the error function, and then fit a…
Q: Find out what steps other customers have taken to fix problems with their computers and mobile apps,…
A: Users often face challenges and frustrations when dealing with issues related to computers or mobile…
Q: kinds of mental pictures do you conjure up whenever you consider email? When you send an email, what…
A: Email is an essential communication tool in today's digital world, allowing people to exchange…
Q: Research and summarize at least 3 issues that typically arise with old requirements engineering…
A: One issue with old requirements engineering practices is that extensive and long specification…
Q: Create an application that reads a sequence of up to 25 names and postal (ZIP) codes for persons.…
A: Create an application that reads a sequence of up to 25 names and postal (ZIP) codes for persons.…
Q: Proposition Q. ( Generic shortest-paths algorithm) Initialize distTo[s] to 0 and all other distTo[]…
A: The proposition Q is a generic algorithm for finding the shortest path between a starting vertex s…
Q: Learn from the errors made by other users by reading about their experiences with difficulties they…
A: In today's digital age, we rely on computers and mobile apps to perform many tasks. However, the use…
Q: What is mean by digital envelope.Explain its working.
A: Describe about digital envelope
Q: In some circumstances, a class is reliant on itself. That is, one class's object interacts with…
A: This question is related to Object-oriented programming. Objects are the instances of classes. It is…
Q: Write a program in the Python language to find the sum of all natural numbers in the range n to 150…
A: Write a program in the Python language to find the sum of all natural numbers in the range n to 150…
Q: Start a conversation about the many ways that mobile devices like tablets and smartphones may be…
A: There are numerous ways that mobile devices like tablets and smartphones can be used in the office.…
Q: You are given a binary tree in which each node contains an integer value (which might be positive or…
A: Traverse the binary tree in a depth-first manner and keep track of the sum of values from the root…
Q: For this MPI Times Table Program please create a program(C++) that runs on N processes to create a…
A: C++ (or “C-plus-plus”) which refers to the one it is a standard-motive programming and coding…
Q: C++ question 1.) Write an iterative routine that will take a string, go through each character of…
A: Dear learner, hope you are doing well, I will try my best to answer this question. According to our…
Q: No Operation (NOP) Sled If you are using a direct address when injecting code, you will be left with…
A: In this question we have to understand the concept of the NOP sled in exploit development. Let's…
Q: Waterfall covers which SDLC steps? This may explain Barry Boehm's findings.
A: In this question we have to understand Waterfall covers which SDLC steps? And to explain Barry…
Q: R, J, and I architecture directives. Many thanks. This article addresses ISA types, architecture,…
A: The architecture of a computer system refers to the way its various components are organized and how…
Q: Theory of Computing PLEASE JUST SEND THE ANSWER IN 5 MINUTES, NO DETAILS!!!!!! PLEASE DON'T BE…
A: Below is the description.
Q: Write an asembler program that samples a 1 KHz sine signal with 16 KHz and outputs t from DACO. DACO…
A: We can write an assembler program to do the given algorithm as follows: Initialize the DACO output…
Q: I would appreciate it if you could share any thoughts you may have on how we might make it simpler…
A: As companies continue to expand their global reach, they must meet the needs of users from different…
Q: /(8).
A: The question asks to write a function that takes an integer n as input, and returns either 12 if n…
Q: It has an impact on society. 2) Establish which cybercrime prevention techniques are most effective.
A: Cybercrime is any illicit activity that targets or employs a computer, computer network, or…
Q: Please provide a Sketch for a website interface page that elabortaes on the importance of fruits &…
A: Below is the complete solution with explanation in detail for the given question about the designing…
Q: Create a JavaFX programme that, at each mouse click, plays a sound effect and shows a picture.…
A: import javafx.application.Application;import javafx.scene.Scene;import…
Q: R, J, and I architecture directives. Many thanks. This article addresses ISA types, architecture,…
A: Instruction set architecture (ISA) is a crucial component of computer architecture that determines a…
Q: Write a python code Step 1: Start Visual Studio Code.. Prior to entering code, save your file by…
A: Start. Import the random library Initialize variables: endProgram to 'no', playerOne and playerTwo…
Q: Which fundamental behavior and assumptions currently fuel the majority of online criminal activity?…
A: Internet access is rapidly becoming one of the most essential tools and most well-known resources…
Q: "Internet of things" has arrived. "three fascinating new uses"?
A: The Internet of Things (IoT) is a term used to describe a network of physical devices, vehicles,…
Q: Is it possible to draw any conclusions or make any suggestions based on this information on…
A: However, generally speaking, it is possible to make recommendations and draw conclusions based on…
Q: eration. After this is done, generate random numbers modulo 4 to obtain random numbers 0, 1, 2, 3…
A: This Python program simulates a vacuum cleaner agent cleaning a two-dimensional grid of size m x n,…
Q: view of a spaceship as it follows the mouse. Have a laser beam (one continuous beam, not a moving…
A: Certainly! The JavaFX program consists of two classes: SpaceshipMouseFollow (the main class) and…
Q: Cloud computing provides environmental benefits. He lived and worked in CS, right? No danger makes…
A: Cloud Computing: When people say "cloud," they mean a network or the internet. It is a system that…
Q: The Association for Computing Machinery's (ACM) code of ethics and behaviour may be broken if public…
A: Privacy issues: Multiple principles of the ACM Code of Ethics and Professional Conduct may be…
Please help step by step with R


Trending now
This is a popular solution!

Step by step
Solved in 3 steps with 1 images


- The time till failure of a part, T years, has the probability density function below and is zero elsewhere, where k is a constant.i. Sketch a graph of the failure rate against time.ii. What does the shape of this graph tell you?You just started your summer internship with immunityPlus based in La Crosse, Wisconsin. You are working with forecasting team to estimate how many doses of an immunization drug will be needed. For each drug estimation, you will be provided the following information: 1. The size of the target population 2. The life expectancy, in yeras of an individual in the population 3. A file containig ages, in years, of a sample of 12 people infected in the population To calculate the number of doses needed: 1. Calulate the average age of infection from a sample of 12 years 2. Calculate the Base reproduction number(Ro) Ro = life expectancy / average age of infection 3. Calculate herd immunity threshold (Q) Q = 1 - 1/Ro 4. Calculate the numebr of doses Doses = Q * population size Construct a profram that allos a user to enter the size of the target population, the life expectancy of an individual in the population, and the name of the sample file. Once this information is obtained, perform the…Let's improvise a scenario in which the CIA's three pillars of security— secret, trust, and vigilance—are all in place.
- Calculate expected value of the scenario xi P(xi)1 0.32 0.393 0.064 0.175 0.08Q: Define water fall model in no more then 5 lines.Please explain Decision Tree X0 X1 X2 X3 Target 1 1 1 1 1 1 1 1 0 1 0 1 0 1 0 0 1 0 0 0 0 0 1 1 0 Which one of the following variables will provide best information gain about Target? Group of answer choices a. X0 b. X2 c. X3 d. X1
- R/R STUDIO: Compute the hat matrix for the following vector of predictors, then use the diag command to extract the leverage values. x=c(1,1,1,1,1,2,10)Create a mathematical model of population growth in which the growth ratio is highest at a certain optimal population size, but it goes down as the population deviates from the optimal size. Then simulate its behavior and see how its behavior differs from that of the logistic growth model....i need Python code and discussionGive an account of the basic building blocks of an ARMA forecasting model
- You are developing a simulation model of a service system and are trying to create an input model of the customer arrival Process, You have the following four observations of the process of interest [86, 24,9, 50] and you are considering either an exponential distributionor a uniform distribution for the model. Using the data to estimate any necessary distribution Parameters, write the steps to plot Q-Q plots for both uniform and exponential distribution. Write the steps clearly. Thanks.Suppose that you have been asked to manage an event which is "A formal dinner party" . 1- Give a WBS for the tasks of the event (at least 3 levels - 0, 1,2). 2- Estimate the time for each task using PERL estimation. 3- Perform a CP analysis (Use the legends from the class)....To avoid a standstill, what conditions must be met?