Rate of glucose transport 0 The below graph plots the rate of glucose transport through a membrane transporter vs glucose concentration in blood. These glucose transporters are most prevalent in which of the listed types of tissues? MARK ALL THAT APPLY 100 200 300 400 500 Concentration of glucose in mg/dl 600
Rate of glucose transport 0 The below graph plots the rate of glucose transport through a membrane transporter vs glucose concentration in blood. These glucose transporters are most prevalent in which of the listed types of tissues? MARK ALL THAT APPLY 100 200 300 400 500 Concentration of glucose in mg/dl 600

Human Physiology: From Cells to Systems (MindTap Course List)
9th Edition
ISBN:9781285866932
Author:Lauralee Sherwood
Publisher:Lauralee Sherwood
Chapter4: Principles Of Neural And Hormonal Communication
Section: Chapter Questions
Problem 1TAHL: The rate at which the Na+K+ pump operates is not constant but is controlled by a combined effect of...

Related questions
Question
Question displayed in picture. Choices are :
neurons, fat, blood brain barrier, liver, muscle, hepatocytes.
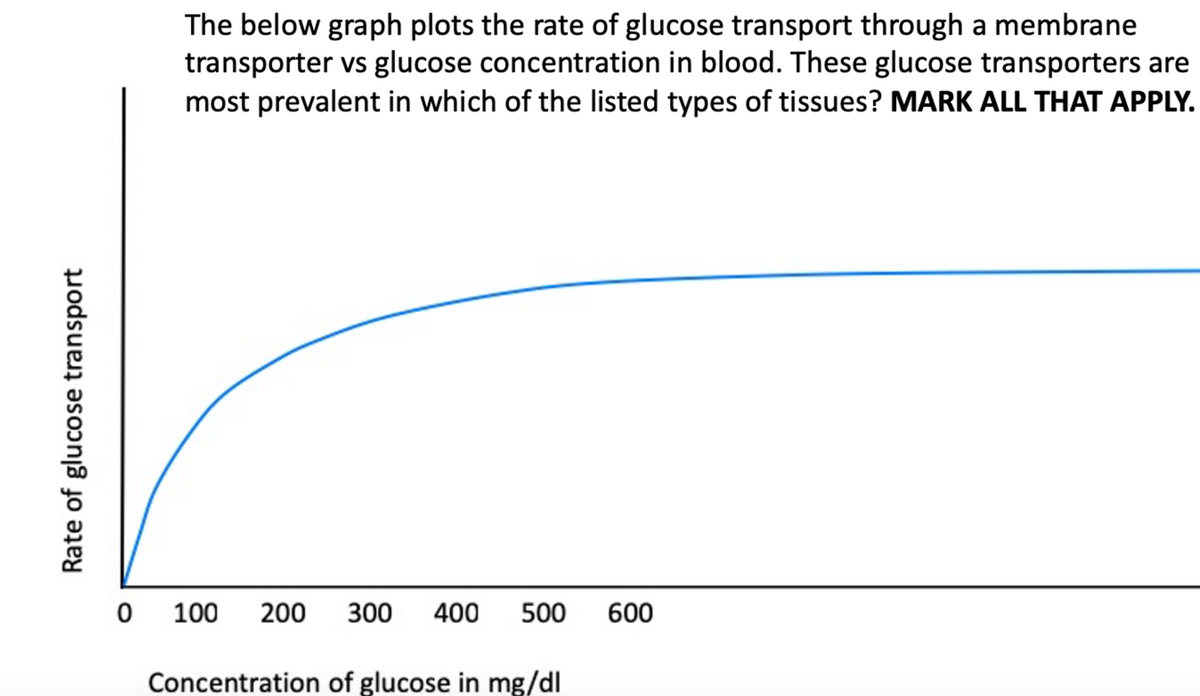
Transcribed Image Text:Rate of glucose transport
The below graph plots the rate of glucose transport through a membrane
transporter vs glucose concentration in blood. These glucose transporters are
most prevalent in which of the listed types of tissues? MARK ALL THAT APPLY.
0 100
200 300 400 500
Concentration of glucose in mg/dl
600
Expert Solution
This question has been solved!
Explore an expertly crafted, step-by-step solution for a thorough understanding of key concepts.

This is a popular solution!

Trending now
This is a popular solution!

Step by step
Solved in 2 steps with 1 images

Recommended textbooks for you
Human Physiology: From Cells to Systems (MindTap …
Biology
ISBN:
9781285866932
Author:
Lauralee Sherwood
Publisher:
Cengage Learning

Human Physiology: From Cells to Systems (MindTap …
Biology
ISBN:
9781285866932
Author:
Lauralee Sherwood
Publisher:
Cengage Learning