The data that follow are the number of passengers on 31 different charter fishing boats. The sample mean is 8.7 passengers and the sample standard deviation is 4.6 passengers. The data follow a uniform distribution where all values between and including 0 and 16 are equally likely. Calculate the theoretical mean and standard deviation assuming that the number of passengers is uniformly distributed. Round your answers to one decimal place as needed. 13 4 9 10 11 15 8 4 8 15 13 1 4 a. What is the mean? 9 11 13 3 12 9 12 0 15 4 10 10 10 2 9 0 (assume that the distribution is uniformly distributed) How does this compare to the mean of the data at 8.7 passengers? Select an answer b. What is the standard deviation? 10 16 How does this compare to 4.6 passengers? Select an answer (assume that the distribution is uniformly distributed)
The data that follow are the number of passengers on 31 different charter fishing boats. The sample mean is 8.7 passengers and the sample standard deviation is 4.6 passengers. The data follow a uniform distribution where all values between and including 0 and 16 are equally likely. Calculate the theoretical mean and standard deviation assuming that the number of passengers is uniformly distributed. Round your answers to one decimal place as needed. 13 4 9 10 11 15 8 4 8 15 13 1 4 a. What is the mean? 9 11 13 3 12 9 12 0 15 4 10 10 10 2 9 0 (assume that the distribution is uniformly distributed) How does this compare to the mean of the data at 8.7 passengers? Select an answer b. What is the standard deviation? 10 16 How does this compare to 4.6 passengers? Select an answer (assume that the distribution is uniformly distributed)

Glencoe Algebra 1, Student Edition, 9780079039897, 0079039898, 2018
18th Edition
ISBN:9780079039897
Author:Carter
Publisher:Carter
Chapter10: Statistics
Section10.4: Distributions Of Data
Problem 19PFA

Related questions
Question
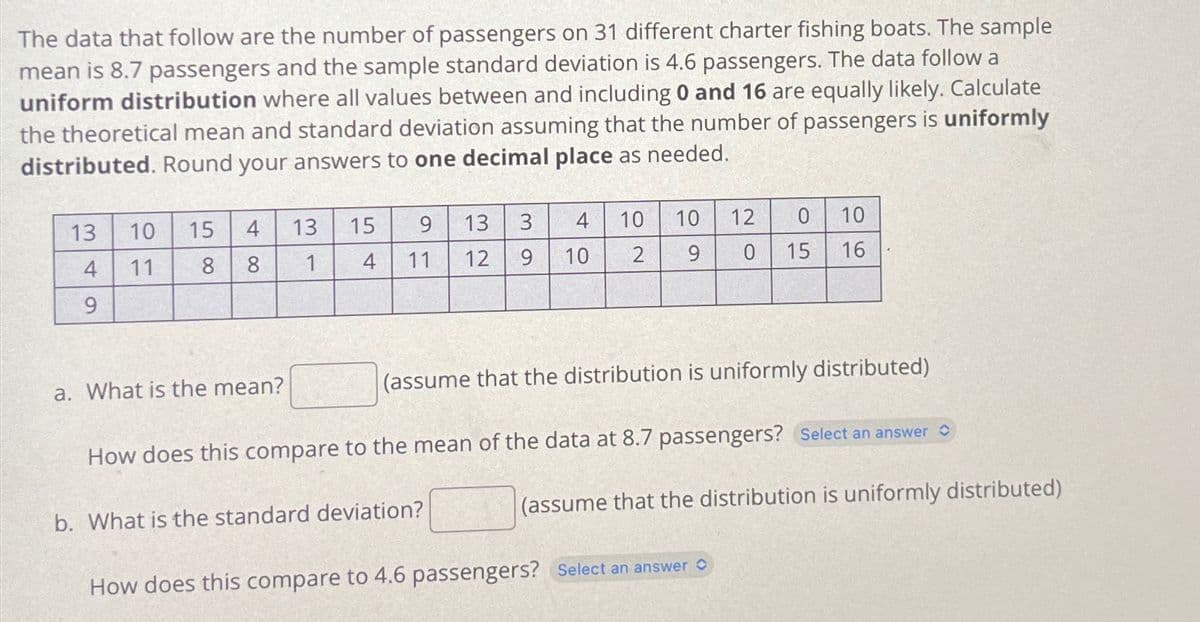
Transcribed Image Text:The data that follow are the number of passengers on 31 different charter fishing boats. The sample
mean is 8.7 passengers and the sample standard deviation is 4.6 passengers. The data follow a
uniform distribution where all values between and including 0 and 16 are equally likely. Calculate
the theoretical mean and standard deviation assuming that the number of passengers is uniformly
distributed. Round your answers to one decimal place as needed.
13
4
9
10 15 4
11
8
8
a. What is the mean?
13
1
3 4
13
10
9
9
15
4
11 12
10
b. What is the standard deviation?
2
10
9
0
0 15
12
(assume that the distribution is uniformly distributed)
10
16
How does this compare to the mean of the data at 8.7 passengers? Select an answer
How does this compare to 4.6 passengers? Select an answer
(assume that the distribution is uniformly distributed)
Expert Solution
This question has been solved!
Explore an expertly crafted, step-by-step solution for a thorough understanding of key concepts.

Step by step
Solved in 4 steps with 7 images

Recommended textbooks for you
Glencoe Algebra 1, Student Edition, 9780079039897…
Algebra
ISBN:
9780079039897
Author:
Carter
Publisher:
McGraw Hill
Glencoe Algebra 1, Student Edition, 9780079039897…
Algebra
ISBN:
9780079039897
Author:
Carter
Publisher:
McGraw Hill