The data of advertisement expenditure (X) and sales (Y) of a company for 10 years is shown in the table below. Determine the correlation coefficient between X and Y.
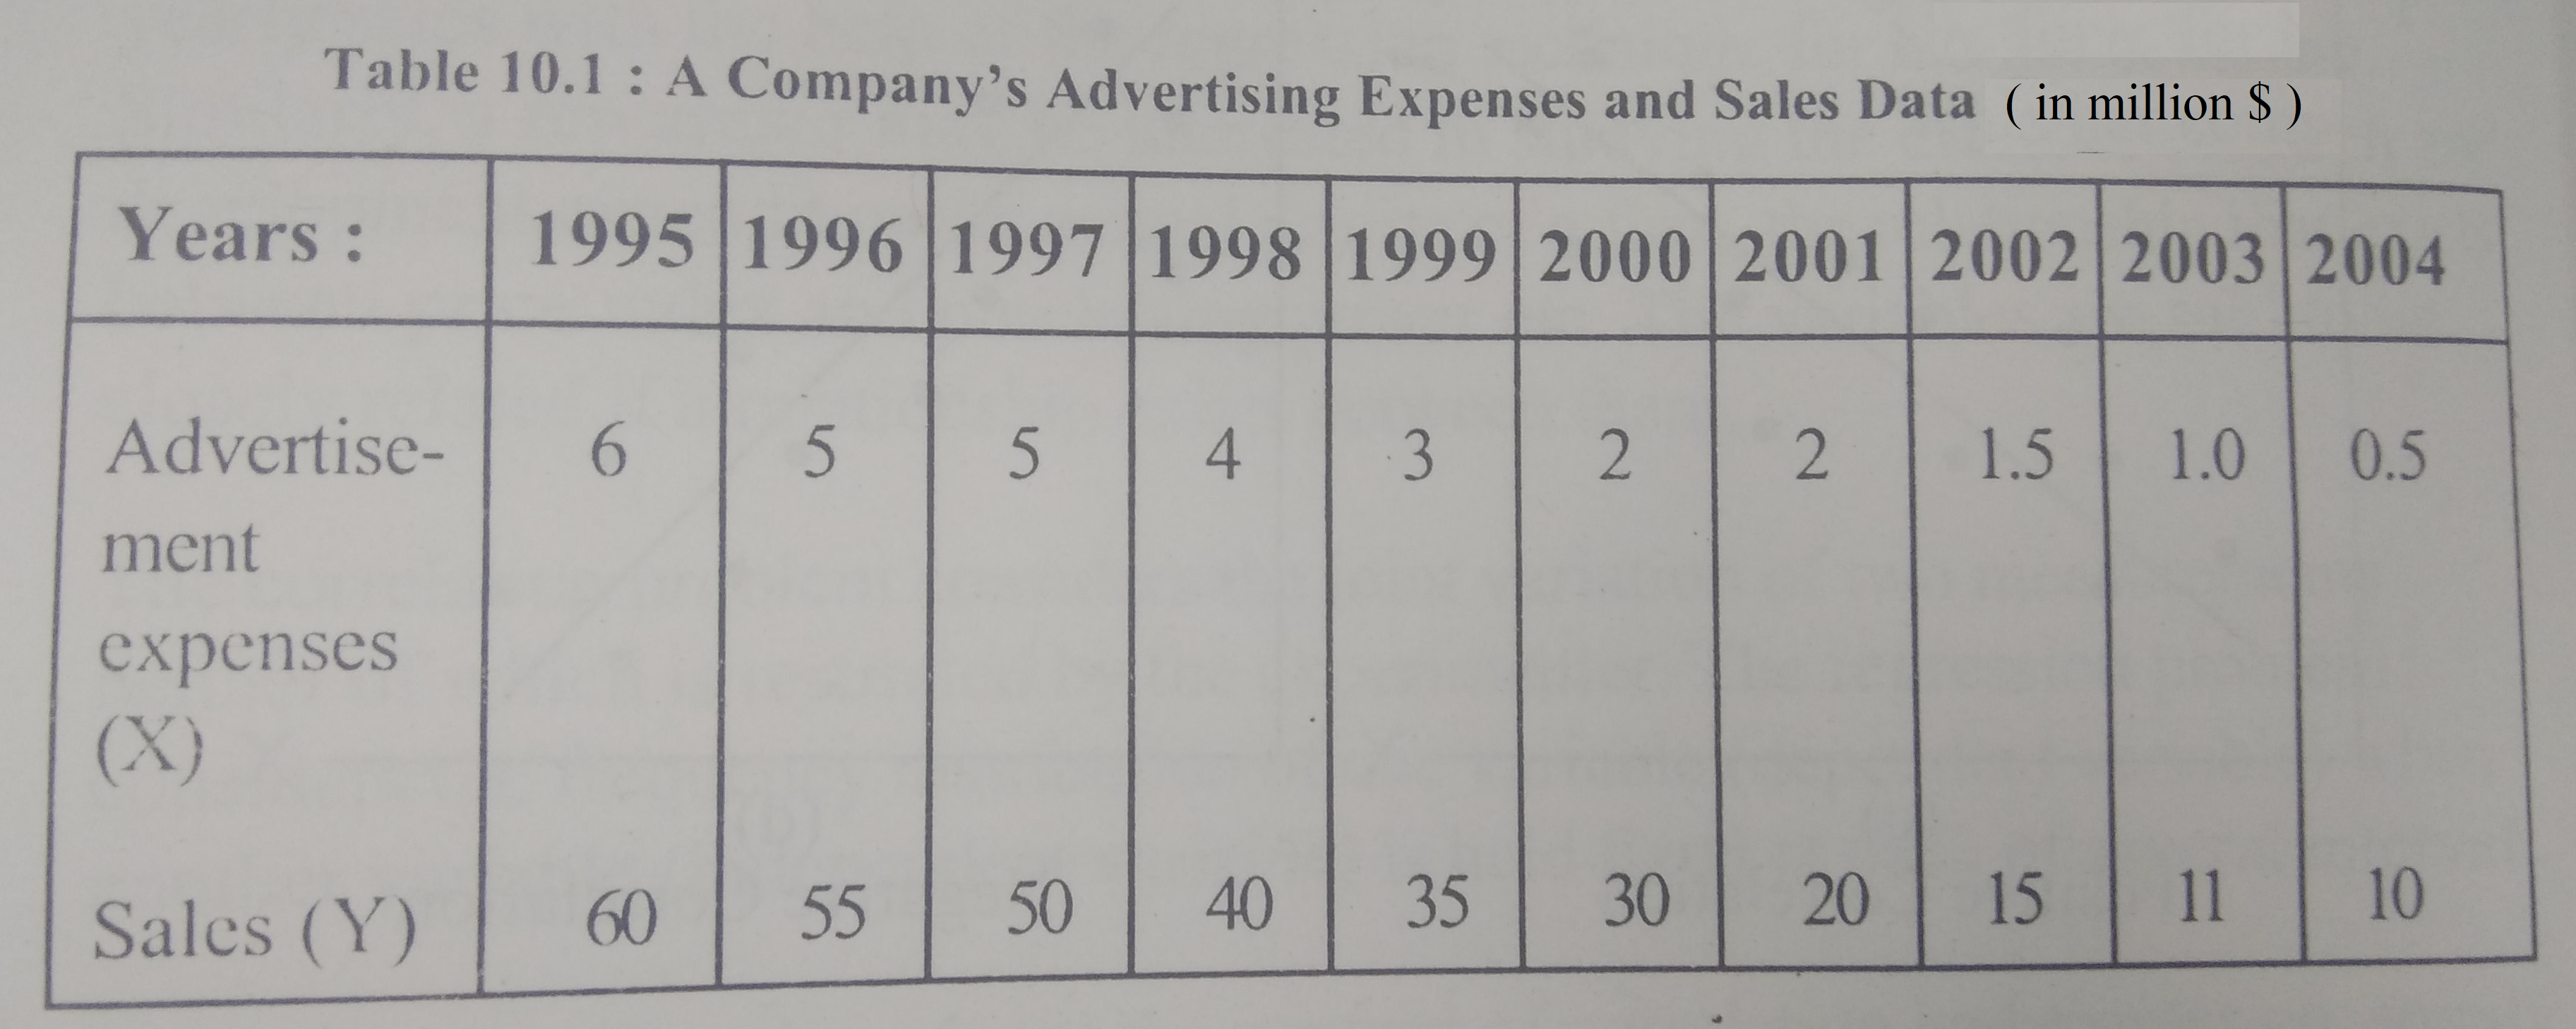
Table 10.1 : A Company's Advertising Expenses and Sales Data ( in million S) [Years- 1995|1996|1997|1998 1999|2000|2001|2002|20013|2004 Advertise 6 5 5 4 3 2 2 1.5 1.0 0.5 ment expenses Sales (Y) 60 5 50 40 35 30 20 15 11 10
Expert Answer
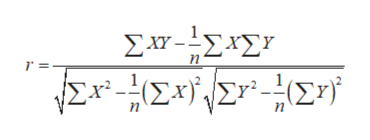
To determine the correlation coefficient, we use its formula shown below.
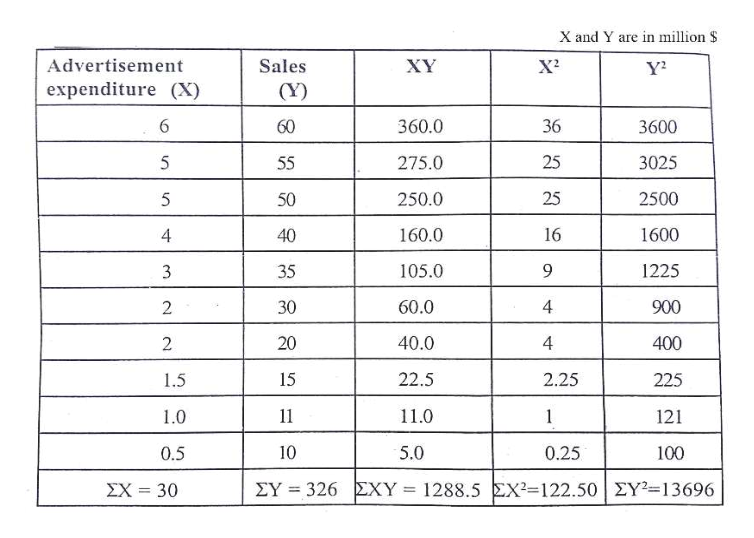
We now calculate all the required values in the formula, in a table shown below.
We now substitute the values obtained in the formula written in step 1.
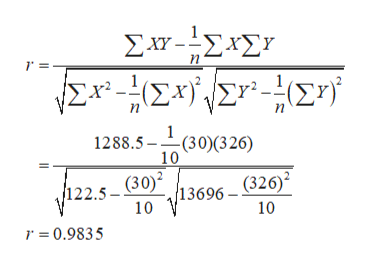
Answer: The correlation coefficient is r = 0.9835 which shows there is a high degree of association between the sales and advertisement expenditure.