Consider heights (in feet) of 20 students in a class.
3.5, 3.8, 4.5, 3.9, 4.1, 4.2, 3.9, 3.5, 4.1, 3.6, 4.3, 3.9, 4.4, 4.1, 4.0, 3.9, 4.3, 4.2, 3.9
Make frequency table for the given data. From the table, find how many students are with height below 3.9 feet.
Expert Answer
The frequency of a particular data value is the number of times that data value occurs. A frequency table is constructed by arranging available data values in ascending order of magnitude with their corresponding frequencies.
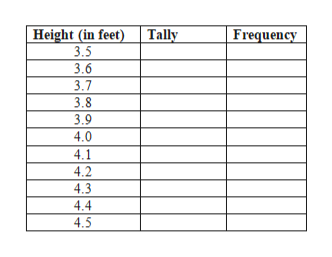
In this case we have heights of students as our data values. We can see that the smallest height is 3.5 feet and largest is 4.5 feet. Let us draw the frequency table using tally method. In the first column of the table we list down heights in ascending order starting from 3.5 feet up to 4.5 feet.
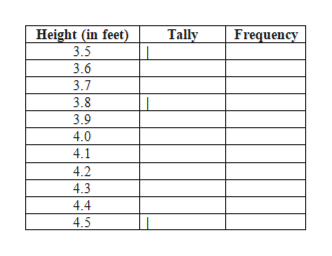
In the second column, we go on putting a vertical bar against a data value, every time we encounter that value in the given data set. For example, the first value from the given data set is 3.5 so we put one vertical bar against height 3.5, the second value from the given data set is 3.8 so we put one vertical bar against height 3.8, the third value from the given data set is 4.5 so we put one vertical bar against height 4.5.
We continue this way and fill up the second column. In tally method, after a group of four vertical bars is collected, the fifth bar is put in the form of a backslash going across the entire group of four vertical bars. This represents the count of 5. This is done for height 3.9 in our table.
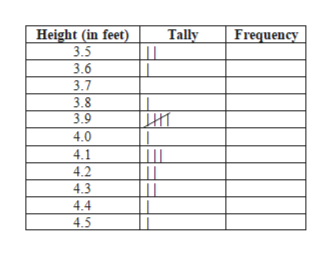
We finally count the frequency using the tally column and fill up the third column.
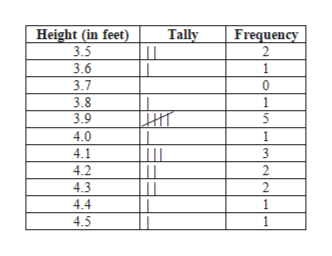
To find the number of students below height 3.9, we add frequency of 3.5, 3.6, 3.7 and 3.8. This is obtained from first four rows of the frequency table. The sum is 2+1+0+1 = 4.
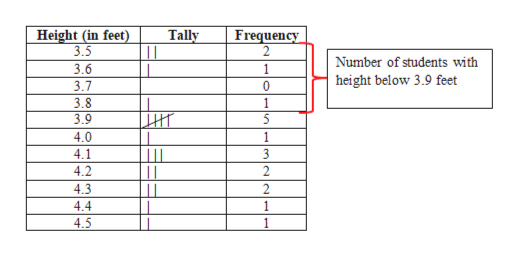
Answer: Number of students with height below 3.9 feet is 4.