a.
To show: The data in tabular form in new worksheet.
Introduction: An investor may purchase stock of a company and become the stockholder (owner) of the company. Based on the performance of the company and demand for company’s stocks, the value of company’s stocks increases or decreases.
Explanation of Solution
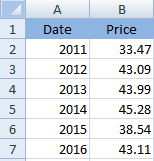
The date have been shown in ‘column A’ while price of stock has been represented in ‘column’ B. The tabular presentation of the given data has been shown below:
b.
To compute: Rate of return for each year.
Introduction: An investor may purchase stock of a company and become the stockholder (owner) of the company. Based on the performance of the company and demand for company’s stocks, the value of company’s stocks increases or decreases.
Explanation of Solution
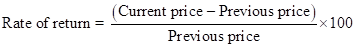
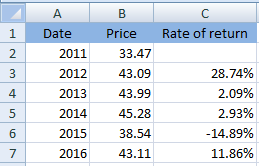
Rate of return for each year has been computed using the following formula:
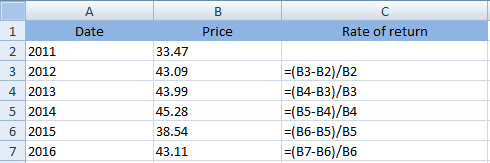
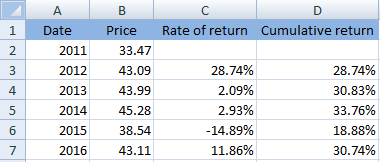
Thus, the calculated rate of return has been shown below:
c.
To compute: Cumulative total return since 2011.
Introduction: An investor may purchase stock of a company and become the stockholder (owner) of the company. Based on the performance of the company and demand for company’s stocks, the value of company’s stocks increases or decreases.
Explanation of Solution
Cumulative rate of return can be computed by adding each year’s rate of return. It can be computed on excel using following formula:
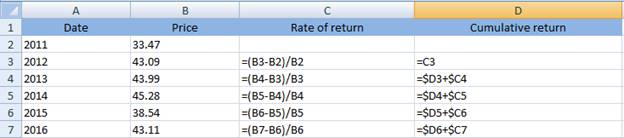
Thus, the calculated cumulative rate of return has been shown below:
d.
To compute: Rate of return for holding period and compound average rate of return.
Introduction: An investor may purchase stock of a company and become the stockholder (owner) of the company. Based on the performance of the company and demand for company’s stocks, the value of company’s stocks increases or decreases.
Explanation of Solution
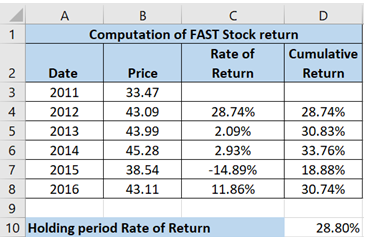
The rate of return for the holding period can be computed as:

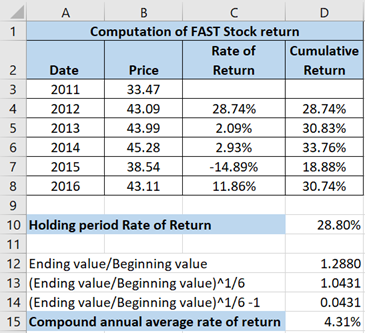
The calculated answer has been shown below:
Now, compound annual average of return can be computed using:

e.
To prepare: Line chart and scattered chart. Also, state the difference between the two charts and suggest the most suitable.
Introduction: An investor may purchase stock of a company and become the stockholder (owner) of the company. Based on the performance of the company and demand for company’s stocks, the value of company’s stocks increases or decreases.
Explanation of Solution
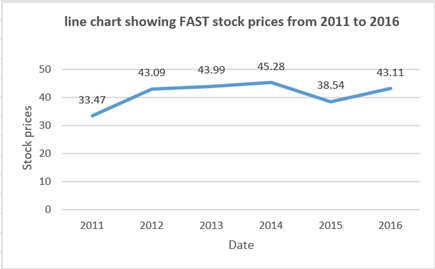
The line chart has been prepared for FAST stock prices:
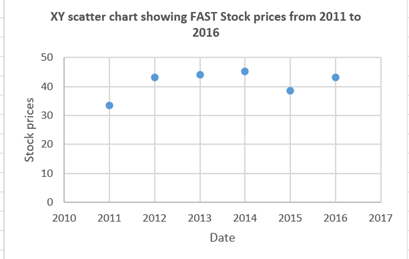
The scattered chart has been prepared for FAST stock prices:
Following are the differences between line and scatter chart:
Line chart: The values ??are plotted only on the y-axis i.e., the vertical axis. While, on the x-axis i.e., the horizontal axis the sequence number of the value is shown. Exceptions: graphs with the date on the X-axis.
Scatter chart: The relationship between two values is represented using the scatter chart. Scatter charts is often known as XY chart.
Here, two different values are not given which means there is no need to find the relationship between two values. So, in order to find trend of stock prices a line chart is more appropriate.
f.
To prepare: 3-D line chart and discuss if it helps in better understanding.
Introduction: An investor may purchase stock of a company and become the stockholder (owner) of the company. Based on the performance of the company and demand for company’s stocks, the value of company’s stocks increases or decreases.
Explanation of Solution
The line chart has been prepared for FAST stock prices:

The 3-D line chart has been prepared:
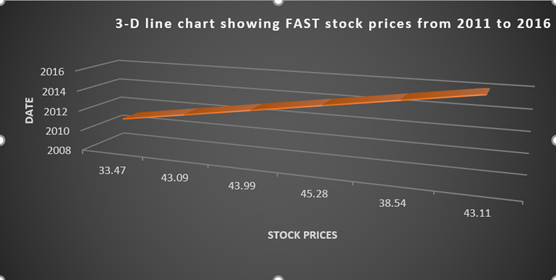
The comparison between the two charts can be seen easily. Thus, yes the enhancements will make data more attractive for the reader.