. Consider a profit-maximizing, perfectly-competitive firm in the short run. Carefully define what we mean by the short run. a. b. Draw a diagram for this firm using the more realistic or complicated case (where the law of diminishing returns does not begin immediately) consisting of an average variable cost curve (AVC), an average total cost curve (ATC), and a marginal cost curve (MC). C. In this diagram, draw in a price (P) or marginal revenue (MR) line for which the firm is earning positive economic profits. Carefully label the profit rectangle. In a new diagram, draw in a P/MR line for which the firm is earning negative economic profits but positive profits on operation. Carefully label the profits on operation rectangle. d. e. For the diagram in 3d, please carefully explain why the firm might continue to produce despite the negative profits. This question concerns the absolute advantage model. Note: not comparative advantage. a. Draw supply and demand diagrams for two countries, France (F) and the Bangladesh (B) with France having an absolute advantage in the good automobiles in autarky. b. Referring to the autarky prices (P", PB), please define absolute advantage in the context of your diagram. c. Next use your diagram to show the movement from autarky to a trading equilibrium. Label imports and exports in the diagram. d. Use the diagram to carefully explain the gains from trade.
. Consider a profit-maximizing, perfectly-competitive firm in the short run. Carefully define what we mean by the short run. a. b. Draw a diagram for this firm using the more realistic or complicated case (where the law of diminishing returns does not begin immediately) consisting of an average variable cost curve (AVC), an average total cost curve (ATC), and a marginal cost curve (MC). C. In this diagram, draw in a price (P) or marginal revenue (MR) line for which the firm is earning positive economic profits. Carefully label the profit rectangle. In a new diagram, draw in a P/MR line for which the firm is earning negative economic profits but positive profits on operation. Carefully label the profits on operation rectangle. d. e. For the diagram in 3d, please carefully explain why the firm might continue to produce despite the negative profits. This question concerns the absolute advantage model. Note: not comparative advantage. a. Draw supply and demand diagrams for two countries, France (F) and the Bangladesh (B) with France having an absolute advantage in the good automobiles in autarky. b. Referring to the autarky prices (P", PB), please define absolute advantage in the context of your diagram. c. Next use your diagram to show the movement from autarky to a trading equilibrium. Label imports and exports in the diagram. d. Use the diagram to carefully explain the gains from trade.

Principles of Economics, 7th Edition (MindTap Course List)
7th Edition
ISBN:9781285165875
Author:N. Gregory Mankiw
Publisher:N. Gregory Mankiw
Chapter14: Firms In Competitive Markets
Section: Chapter Questions
Problem 4PA

Related questions
Question
Need help with top half of attached picture
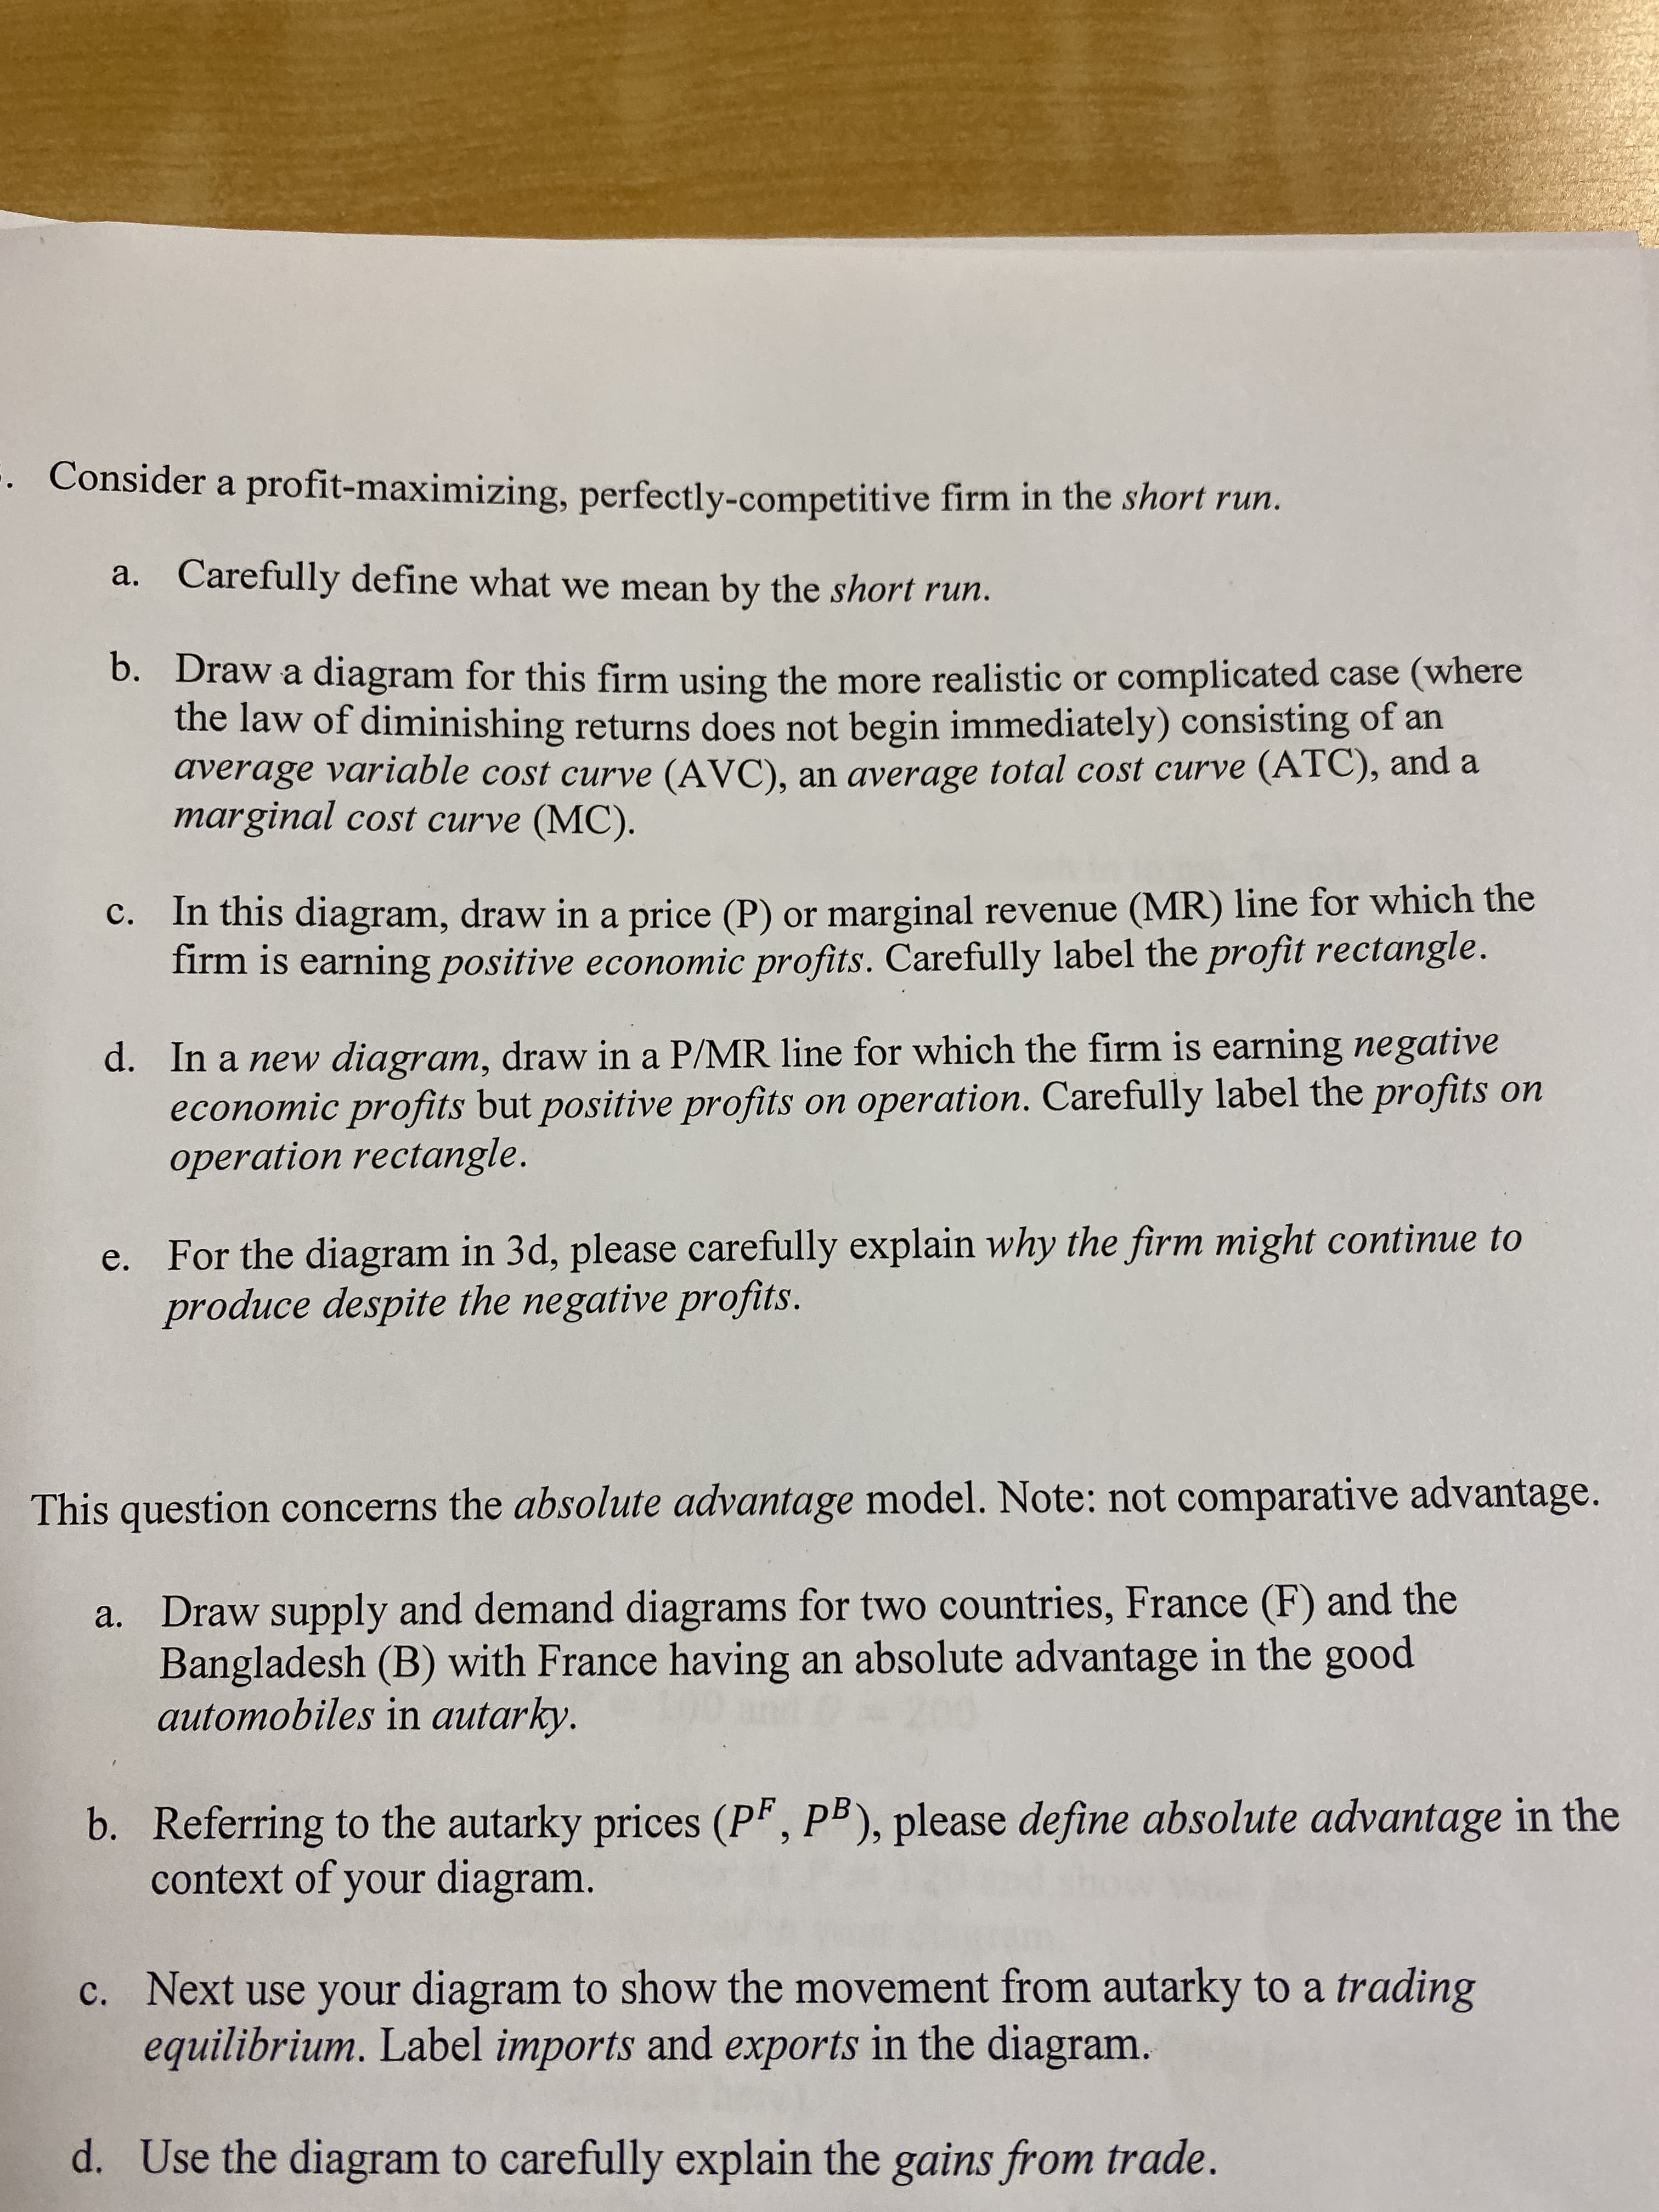
Transcribed Image Text:. Consider a profit-maximizing, perfectly-competitive firm in the short run.
Carefully define what we mean by the short run.
a.
b. Draw a diagram for this firm using the more realistic or complicated case (where
the law of diminishing returns does not begin immediately) consisting of an
average variable cost curve (AVC), an average total cost curve (ATC), and a
marginal cost curve (MC).
C. In this diagram, draw in a price (P) or marginal revenue (MR) line for which the
firm is earning positive economic profits. Carefully label the profit rectangle.
In a new diagram, draw in a P/MR line for which the firm is earning negative
economic profits but positive profits on operation. Carefully label the profits on
operation rectangle.
d.
e. For the diagram in 3d, please carefully explain why the firm might continue to
produce despite the negative profits.
This question concerns the absolute advantage model. Note: not comparative advantage.
a. Draw supply and demand diagrams for two countries, France (F) and the
Bangladesh (B) with France having an absolute advantage in the good
automobiles in autarky.
b. Referring to the autarky prices (P", PB), please define absolute advantage in the
context of your diagram.
c. Next use your diagram to show the movement from autarky to a trading
equilibrium. Label imports and exports in the diagram.
d. Use the diagram to carefully explain the gains from trade.
Expert Solution
This question has been solved!
Explore an expertly crafted, step-by-step solution for a thorough understanding of key concepts.

This is a popular solution!

Trending now
This is a popular solution!

Step by step
Solved in 3 steps with 2 images

Knowledge Booster


Learn more about
Need a deep-dive on the concept behind this application? Look no further. Learn more about this topic, economics and related others by exploring similar questions and additional content below.Recommended textbooks for you
Principles of Economics, 7th Edition (MindTap Cou…
Economics
ISBN:
9781285165875
Author:
N. Gregory Mankiw
Publisher:
Cengage Learning

Essentials of Economics (MindTap Course List)
Economics
ISBN:
9781337091992
Author:
N. Gregory Mankiw
Publisher:
Cengage Learning

Principles of Microeconomics (MindTap Course List)
Economics
ISBN:
9781305971493
Author:
N. Gregory Mankiw
Publisher:
Cengage Learning
Principles of Economics, 7th Edition (MindTap Cou…
Economics
ISBN:
9781285165875
Author:
N. Gregory Mankiw
Publisher:
Cengage Learning
Essentials of Economics (MindTap Course List)
Economics
ISBN:
9781337091992
Author:
N. Gregory Mankiw
Publisher:
Cengage Learning
Principles of Microeconomics (MindTap Course List)
Economics
ISBN:
9781305971493
Author:
N. Gregory Mankiw
Publisher:
Cengage Learning

Principles of Economics (MindTap Course List)
Economics
ISBN:
9781305585126
Author:
N. Gregory Mankiw
Publisher:
Cengage Learning

Principles of Microeconomics
Economics
ISBN:
9781305156050
Author:
N. Gregory Mankiw
Publisher:
Cengage Learning
