0.0g 001 0001 0001 .00o1 0001 0001 0002 0002.0002 0002 0002 0X02 0.04 0.05 0.06 0.07 0.08 (00 0003 0003 0003 0003 0002 000 0004 0004 0004 0004 0003 W0006 0006 0006 0005 0005 0005 000008 0008 0008 0008 0007 0007 02 0012 0011 .0011 0011 0010 0010 0160016 (015 0013 0014 .0014 0002 0021 0021 0020 0019 00029 0028 0027 0026 0039 0038 0037 0036 0051 0049 0048 .0066 0064 .0084 
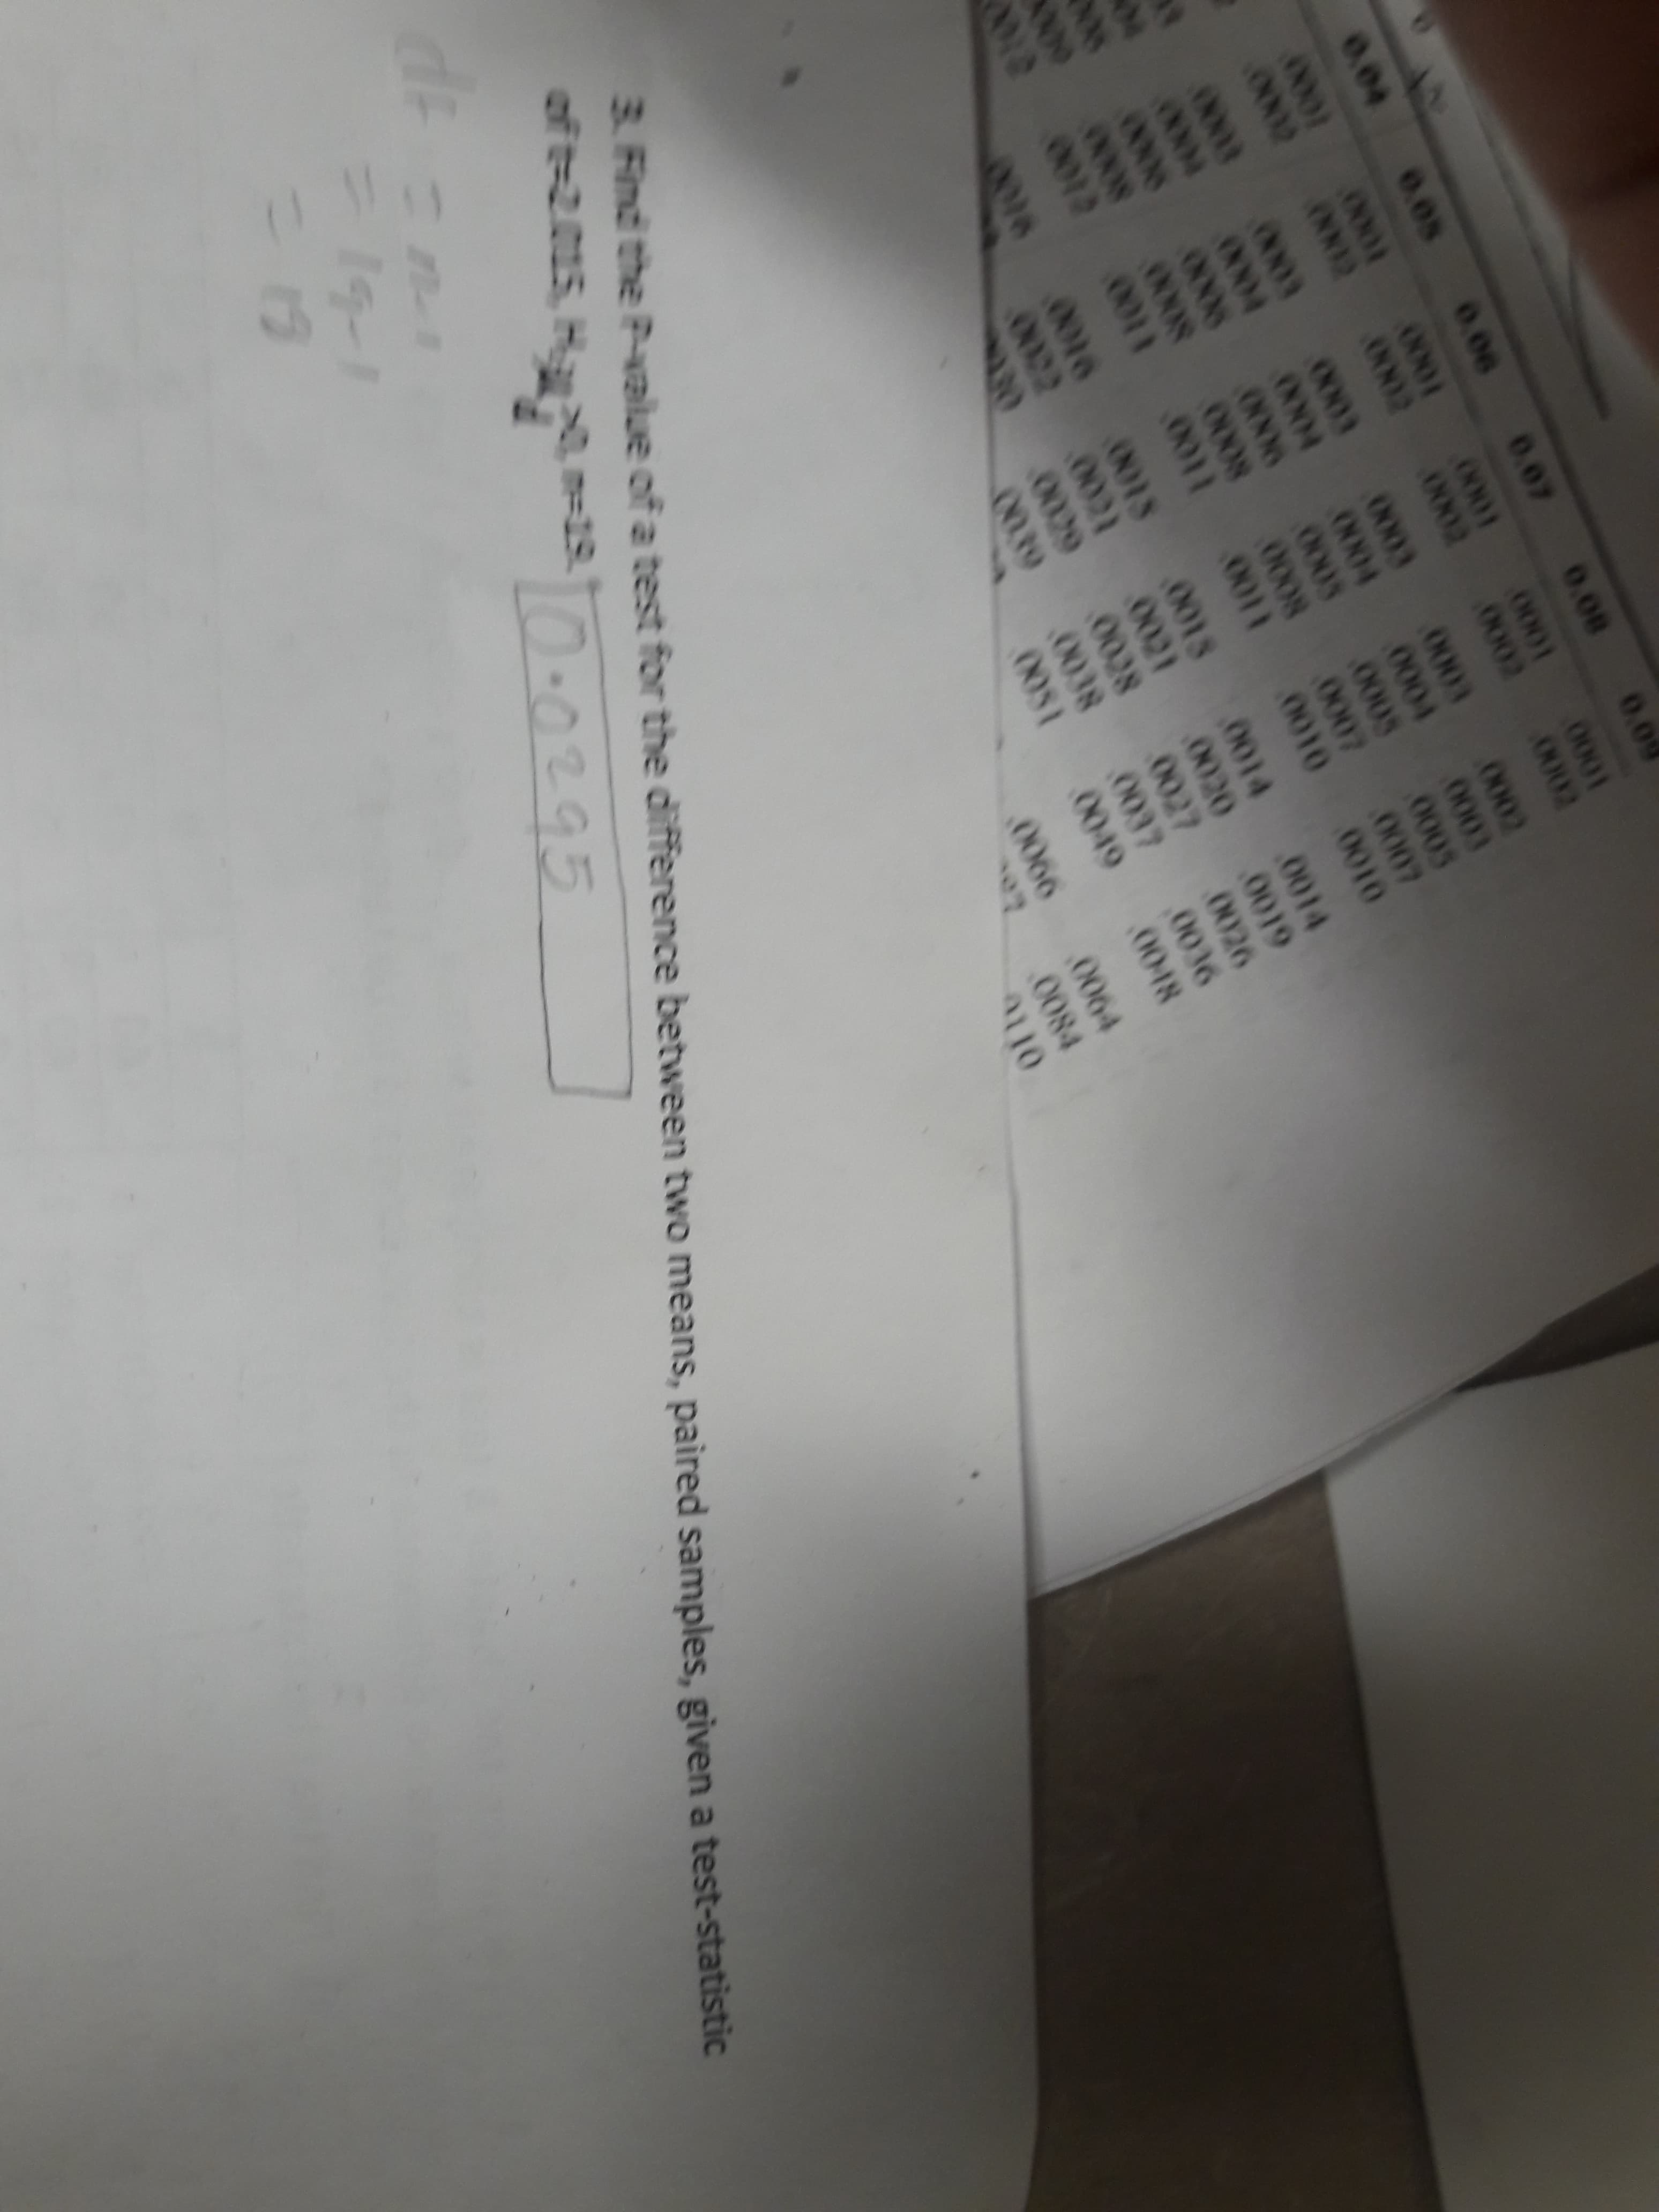
3. Find the Pvalue of a test for the difference between two means, paired samples, given a test-statistic of t-2.015, Ha-1s..0295 de =19. %2410.0295 14-1
Q: The economic dynamism, which is the index of productive growth (in dollars) for countries that are…
A: vii) For the given sample, Sample mean=43.8727, excel function, =AVERAGE(J1:J26) Sample standard…
Q: Table 3 shows the average monthly attendance at LakeNacimiento in California. Find the equation of a…
A: Below graph and table shows the average monthly attendance at Lake Nacimiento in California.
Q: Quarters. In Exercises 9-12, refer to the accompanying table of weights (grams) of quarters minted…
A: Steps to construct Run chart: Enter the 100 individual values in Excel sheet. Select the…
Q: Refer to Table 3.10.What is the conditional probability of “high income,” given “never”?
A: It is given that,
Q: Consider the following table from Neal & Johnson (1995). Which of the following statements are true:…
A: Hi! Thank you for the question, As per the honor code, we are allowed to answer one question at a…
Q: In this problem, we use your critical values table to explore the significance of r based on…
A: (a) From the provided critical values, the correlation coefficient at α=0.01α=0.01 for a sample…
Q: The economic dynamism, which is the index of productive growth (in dollars) for countries that are…
A: Hello! As you have posted more than 3 sub parts, we are answering the first 3 sub-parts. In case…
Q: Year Population 1790 3,929,214 1800 5,308,483 1810 7,239,881 1820 9,638,453 1830…
A: Simple Linear Regression: The plot shows the linear relationship between the regressor Y and…
Q: Subject Extroversion Neuroticism 1 43 49 2 46 53 3 48 67 4 48 57 5 48 56 6 50 48 7 51 60 8…
A: Let x represents the Extroversion and y represents Neuroticism. Therefore the data is given as: x…
Q: Example 17.12. If T1 and T2 are two unbiased estimators of y(0), having the same variance and p is…
A:
Q: The number of users of a certain website (in millions) from 2004 through 2011 follows. Year Period…
A: a) Enter the data in Excel.
Q: The test results of fresh students in statistics out of 20% is give below 5 13.5 5.5 7.25 7.25 9.25…
A: In the given data total number of observations, N = 55 To create a grouped frequency distribution…
Q: 1- Movie budget amounts (in million of dollars) 4.5 5 6.5 7…
A: 1- Movie budget amounts (in millions of dollars) 4.5 5 6.5 7…
Q: The following are the monthly rates of return for Dermot Ltd and for Solid Foods Ltd during a…
A: “Since you have posted a question with multiple sub-parts, we will solve first three sub-parts for…
Q: The economic dynamism, which is the index of productive growth (in dollars) for countries that are…
A: From the provided information, Sample size (n) = 26 Level of significance (α) = 0.05
Q: 1. p = 0.35 sample size = 180 sample proportion = 0.40 %3D 2. p = 0.36 sample size = 250 sample…
A:
Q: 9. For each of the following, indicate whether the data are cross-sectional or time-series: (A)…
A:
Q: If X and Y are uncorrelated, then they are not necessarily statistically independent.
A: if X ad Y are independent the they are uncorrelated but converse is not true
Q: Household Income ($1000s) $0- 24.9 $25 - 49.9 $50 - 74.9 $75-99.9 Education Level $100+ Total Not…
A: Since you have posted a question with multiple sub-parts, we will solve first three sub-parts for…
Q: Out of the following data sets, which is best described as having a positive exponential…
A: The scatter plot of option a) is The scatter plot of option b) is
Q: Listed below are amounts (in millions of dollars) collected from parking meters by a security…
A:
Q: Assume an observed number of deaths from 1950 of 54,273 and an observed number of deaths from 19
A: Given information: The data represents the mortality rate per 100000 and total population for the…
Q: Age Male Females 21…
A: The probability that a female of age 23 years die within a year is given as, P(die)=0.000496. As…
Q: Q. 5 The following data present deaths by cause and mid-year population: 1960 Costa Rican males.…
A: i) We have to determine age-specific death rates. This can be calculated by taking the ratio of the…
Q: Listed below are amounts (in millions of dollars) collected from parking meters by a security…
A: Coefficient of variation for security service company
Q: QUESTION 6 A large chain retailer purchases a certain kind of electronic device from a manufacturer.…
A:
Q: Education Level Not H.S. Graduate $0 - 24.9 $25 - 49.9 $50 - 74.9 $75 - 99.9 $100+ Total 4,207 3,459…
A: Hey, since there are multiple subparts posted, we will answer the first three subparts. If you want…
Q: The economic dynamism, which is the index of productive growth (in dollars) for countries that are…
A: iv) Sample mean: x-bar= 43.8727 from the excel function, =AVERAGE(J1:J26) v) Sample…
Q: Solve the mean and variance of the following set problems. 1. X 0 1 2 3 P(x) 0.11 0.22 0.33 0.25 2.…
A:
Q: Organ Transplantation Listed below is information regarding organ transplantation for three…
A: The appropriate hypothesis for the required test is as follows H0: There is no significant…
Q: The economic dynamism, which is the index of productive growth (in dollars) for countries that are…
A: Sample x (x-x̄)2 1 25.8057 326.4562376 2 41.1648 7.338681 3 49.1361 27.69180129 4 50.9866…
Q: Find out the variance of the following series : Income No. of Persons More than 1000 900 800 700 600…
A:
Q: AGE (x) PA (y) x^2 Y^2 XY 20 120 400 14400 2400 43 128 1849 16384 5504 63 141 3969 19881 8883 26 126…
A: Hi! Thank you for the question, As per the honor code, we are allowed to answer three sub-parts at a…
Q: Is the difference between the mean annual salaries of statisticians in Region 1 and Region 2 more…
A: Given: Sample sizes: n1=42n2=40 Sample means: X¯1=67100X¯2=66000 Population standard deviations:…
Q: Compute a 95% confidence interval for the mean economic dynamism of middle-income countries by…
A:
Q: A certain manufacturing company has the following data on quantities shipped and unit costs for each…
A: The table below shows the required calculation for obtaining Paasche’s index-
Q: Please help
A: For sample mean (x¯), the Z-score is, Z=x¯-μσnwhere μ=population mean σ=population…
Q: Suppose we have the following data on the number of car crashes each month for the year 2020 in the…
A: We have to test that if number accident varies seasonally or it is constant over months for that we…
Q: Covariance Analysis: Ordinary Date: 01/07/22 Time: 20:01 Sample: 2010 2019 Included observations: 10…
A: TO GFCF GDP IM FDI EX CO2C TO 1 GFCF -0.9 1 GDP -0.93 1 1 IM…
Q: You are given the following excerpt from a life table, including mortality rates and expected value…
A: Given the excerpt from a life table, including mortality rates and expected of a 1 unit whole life…
Q: Calculate the crude mortality rate per 100,000 population for 1950, 1990, and 2000.
A: Given information: The data represents the mortality rate per 100000 and total population for the…
Q: Percent Under 21 Fatal Accidents per 1000 13 2.962 12 0.708 8 0.885 12 1.652 11 2.091 17 2.627 18…
A:
Q: Calculate the direct adjusted mortality rate for both 1950 and 1990 using the 2000 information as…
A: Given information: The data represents the mortality rate per 100000 and total population for the…
Q: You test a new drug to reduce blood pressure. A group of 15 patients with high blood pressure report…
A: Since you have posted a question with multiple sub-parts, we will solve first three sub-parts for…
Q: The economic dynamism, which is the index of productive growth (in dollars) for countries that are…
A: (iv) Obtain the t score for the 95% confidence level. The t score for the 95% confidence level…
Q: Year Population 1790 3,929,214 1800 5,308,483 1810 7,239,881 1820 9,638,453 1830…
A: Hi, we are supposed to answer three sub parts at a time. Since you have not mentioned which subpart…
Q: Use excel to calculate the Least Squares Regression Line for the census data? (need to include…
A: We have used the excel data analysis tool to run the regression analysis.
Q: The accompanying table shows a portion of data consisting of the selling price, the age, and the…
A: Use EXCEL to construct the sample regression equation. EXCEL procedure: Go to EXCEL Go to…
Q: 5) What is the predictable blood pressure for a 20 year old man? 6) Plot the regression line…
A: y = 0.4373x + 112.43 When x =20, then predicted blood pressure is y = (0.4373 x 20) + 112.43 y =…
could you please help me understand better. do not use excel.
Step by step
Solved in 4 steps with 3 images
- 31 Data: Red Blue Brown Green Yellow0.744 0.844 0.918 0.942 0.8680.813 0.726 0.743 0.798 0.7240.997 0.717 0.818 0.727 0.7540.927 0.882 0.994 0.842 0.9510.825 0.969 0.997 0.828 0.771 0.993 0.918 0.854 0.999 0.786 0.963 0.972 0.872 0.904 0.752PercentUnder 21 Fatal Accidentsper 1000 13 2.962 12 0.708 8 0.885 12 1.652 11 2.091 17 2.627 18 3.83 8 0.368 13 1.142 8 0.645 9 1.028 16 2.801 12 1.405 9 1.433 10 0.039 9 0.338 11 1.849 12 2.246 14 2.855 14 2.352 11 1.294 17 4.1 8 2.19 16 3.623 15 2.623 9 0.835 8 0.82 14 2.89 8 1.267 15 3.224 10 1.014 10 0.493 14 1.443 18 3.614 10 1.926 14 1.643 16 2.943 12 1.913 15 2.814 13 2.634 9 0.926 17 3.256 D. Give a 95% interval estimate of the number of fatal accidents per 1000 licenses ina city where 15% of the licensed drivers are under 21Restaurant X Restaurant Y89 101121 125116 153143 117270 171183 134122 114151 122158 127210 129335 137305 140181 227116 216161 291152 12595 95238 136243 242189 146155 148196 201168 149123 14262 141198 143182 154117 139139 169169 138185 244198 234236 248192 237352 234304 165213 85192 110183 58184 172107 79143 147175 138157 99173 131155 150170 127127 185136 145306 132 Refer to the accompanying data set of mean drive-through service times at dinner in seconds at two fast food restaurants. Construct a 95% confidence interval estimate of the mean drive-through service time for Restaurant X at dinner; then do the same for Restaurant Y. Compare the results. Construct a 95% confidence interval of the mean drive-through service times at dinner for Restaurant X.
- Average Water Temp Manatee Deaths 72.0 35 71.9 38 71.7 42 71.7 49 71.6 53 71.5 54 71.4 60 71.0 67 71.2 68 71.2 69 71.1 73 71.0 73 70.9 73 70.9 78 70.8 79 70.7 81 70.6 81 70.6 82 70.5 83 70.5 88 70.4 90 69.9 92 69.8 95 69.5 97 A researcher is interested to see if there is an association between average water temperature and manatee deaths in sub-tropical regions, and decides to test for linear correlation at the 0.01 significance level. The researcher takes a random sample of subtropical regions and measures their number of manatee deaths and average water temperature. The table above gives the paired data for 24 randomly selected subtropical regions. Do a scatterplot of average water temperature and manatee deaths for this random sample of sub-tropical regions and report your impression of whether or not there seems to…Male Female 28,429 21,890 14,798 23,569 5,443 6,800 26,258 16,895 26,723 10,669 6,907 14,890 23,016 13,017 19,009 17,690 25,050 14,742 21,192 20,420 10,338 14,333 10,465 14,395 14,010 16,864 20,648 23,820 19,856 4,245 63 19,225 21,420 23,626 11,319 17,292 20,356 15,343 17,492 13,514 16,299 28,660 21,793 10,057 7,288 18,481 7,960 5,205 25,062 9,611 10,186 17,995 13,921 13,983 12,942 21,676 11,655 22,780 19,207 11,796 12,895 33,935 7,911 9,825 20,749 11,633 17,120 10,489 12,477 30,066 13,810 20,778 17,041 18,452 11,364 20,982 20,462 21,013 10,940 15,980 13,828 17,134 5,741…TABLE 1 z .09 .08 .07 .06 .05 .04 .03 .02 .01 .00-3.4 0.0002 0.0003 0.0003 0.0003 0.0003 0.0003 0.0003 0.0003 0.0003 0.0003-3.3 0.0003 0.0004 0.0004 0.0004 0.0004 0.0004 0.0004 0.0005 0.0005 0.0005-3.2 0.0005 0.0005 0.0005 0.0006 0.0006 0.0006 0.0006 0.0006 0.0007 0.0007-3.1 0.0007 0.0007 0.0008 0.0008 0.0008 0.0008 0.0009 0.0009 0.0009 0.0010-3.0 0.0010 0.0010 0.0011 0.0011 0.0011 0.0012 0.0012 0.0013 0.0013 0.0013-2.9 0.0014 0.0014 0.0015 0.0015 0.0016 0.0016 0.0017 0.0018 0.0018 0.0019-2.8 0.0019 0.0020 0.0021 0.0021 0.0022 0.0023 0.0023 0.0024 0.0025 0.0026-2.7 0.0026 0.0027 0.0028 0.0029 0.0030 0.0031 0.0032 0.0033 0.0034 0.0035-2.6 0.0036 0.0037 0.0038 0.0039 0.0040 0.0041 0.0043 0.0044 0.0045 0.0047-2.5 0.0048 0.0049 0.0051 0.0052 0.0054 0.0055 0.0057 0.0059 0.0060 0.0062-2.4 0.0064 0.0066 0.0068 0.0069 0.0071 0.0073 0.0075 0.0078 0.0080 0.0082-2.3 0.0084 0.0087 0.0089 0.0091 0.0094 0.0096 0.0099 0.0102 0.0104 0.0107-2.2 0.0110 0.0113 0.0116 0.0119 0.0122 0.0125 0.0129 0.0132…
- 0.7200.7400.6400.3900.7002.2001.9800.6401.2200.2001.6401.3402.9500.9001.7601.0101.2600.0000.6501.4601.6201.8300.9901.5600.4101.2800.8301.3200.5401.2500.9201.0000.7800.7901.4401.0002.2402.5001.7901.2501.4900.8401.4201.0001.2501.4201.3500.9300.4001.390 The accompanying data table lists the magnitudes of 50 earthquakes measured on the Richter scale. Test the claim that the population of earthquakes has a mean magnitude greater than 1.00. Use a 0.01significance level. Identify the null hypothesis, alternative hypothesis, test statistic, P-value, and conclusion for the test. Assume this is a simple random sample the sample data is above. What are the hypotheses? A. H0: μ=1.00 in magnitude H1: μ≠1.00 in magnitude B. H0: μ=1.00 in magnitude H1: μ<1.00 in magnitude C. H0: μ=1.00 in magnitude H1: μ>1.00 in magnitude D. H0: μ≠1.00 in magnitude H1: μ=1.00 in magnitude Identify the test statistic. t= (Round to two decimal places as…The table below contains real data for the first two decades of AIDS reporting. Year # AIDS cases diagnosed # AIDS deaths Pre–1981 91 29 1981 319 121 1982 1,170 453 1983 3,076 1,482 1984 6,240 3,466 1985 11,776 6,878 1986 19,032 11,987 1987 28,564 16,162 1988 35,447 20,868 1989 42,674 27,591 1990 48,634 31,335 1991 59,660 36,560 1992 78,530 41,055 1993 78,834 44,730 1994 71,874 49,095 1995 68,505 49,456 1996 59,347 38,510 1997 47,149 20,736 1998 38,393 19,005 1999 25,174 18,454 2000 25,522 17,347 2001 25,643 17,402 2002 26,464 16,371 Total 802,118 489,093 Graph "year" vs. "# AIDS deaths." Do not include pre-1981. Label both axes with words. Scale both axes. Calculate the following. (Round your answers to the nearest whole number. Round the correlation coefficient r to four decimal places.) (a) a = (b) b = (c) r = (d) n =The table below contains real data for the first two decades of AIDS reporting. Year # AIDS cases diagnosed # AIDS deaths Pre–1981 91 29 1981 319 121 1982 1,170 453 1983 3,076 1,482 1984 6,240 3,466 1985 11,776 6,878 1986 19,032 11,987 1987 28,564 16,162 1988 35,447 20,868 1989 42,674 27,591 1990 48,634 31,335 1991 59,660 36,560 1992 78,530 41,055 1993 78,834 44,730 1994 71,874 49,095 1995 68,505 49,456 1996 59,347 38,510 1997 47,149 20,736 1998 38,393 19,005 1999 25,174 18,454 2000 25,522 17,347 2001 25,643 17,402 2002 26,464 16,371 Total 802,118 489,093 Graph "year" versus "# AIDS cases diagnosed" (plot the scatter plot). Do not include pre-1981 data. Perform linear regression. Write the equations. (Round your answers to the nearest whole number. Round r to four decimal places.) (a) Linear Equation: ŷ = + x(b) a = (c) b = (d) r = (e) n =
- part C D 33000331 UPH-1 St. Lawrence dolomite 618 0.05 2.69 2.74 2.83 48000168 Langer Platteville dolomite 127.8 0.06 2.69 2.75 2.86 52000415 3-21-13z1 Galena dolomite 575 0.04 2.72 2.76 2.83 52000415 3-21-13z1 Platteville dolomite 740 0.05 2.7 2.75 2.85 60000086 VD #1 Silurian dolomite 684 0.03 2.75 2.78 2.83 60000086 VD #1 Galena dolomite 1070 0.05 2.69 2.74 2.84 60000086 VD #1 Platteville dolomite 1142 0.02 2.77 2.79 2.83 13001466 NS-2 Tunnel City sandstone 60.1 0.14 2.41 2.54 2.79 13001466 NS-2 Tunnel City sandstone 60.2 0.28 1.93 2.21 2.67 13001466 NS-2 Tunnel City sandstone 118.3 0.3 1.88 2.18 2.7 33000331 UPH-1 St. Peter sandstone 222 0.22 2.06 2.28 2.65 33000331 UPH-1 Jordan sandstone 531 0.21 2.09 2.3 2.65 33000331 UPH-1 Tunnel City sandstone 644 0.18 2.22 2.4 2.7 33000331 UPH-1 Wonewoc sandstone 735 0.2 2.12 2.32 2.65 33000331 UPH-1 Wonewoc sandstone 840 0.27 1.93 2.2 2.66 33000331 UPH-1 Mt. Simon sandstone 927 0.18 2.31 2.49 2.81…0.75 0.90 0.95 0.975 0.99 0.995 Upper-Tail Areas Degrees of Freedom 0.25 0.10 0.05 0.025 0.01 0.005 1 1.0000 3.0777 6.3138 12.7062 31.8207 63.6574 2 0.8165 1.8856 2.9200 4.3027 6.9646 9.9248 3 0.7649 1.6377 2.3534 3.1824 4.5407 5.8409 4 0.7407 1.5332 2.1318 2.7764 3.7469 4.6041 5 0.7267 1.4759 2.0150 2.5706 3.3649 4.0322 6 0.7176 1.4398 1.9432 2.4469 3.1427 3.7074 7 0.7111 1.4149 1.8946 2.3646 2.9980 3.4995 8 0.7064 1.3968 1.8595 2.3060 2.8965 3.3554 9 0.7027 1.3830 1.8331 2.2622 2.8214 3.2498 10 0.6998 1.3722 1.8125 2.2281 2.7638 3.1693 11 0.6974 1.3634 1.7959 2.2010 2.7181 3.1058 12 0.6955 1.3562 1.7823 2.1788 2.6810 3.0545 13 0.6938 1.3502 1.7709 2.1604 2.6503 3.0123 14 0.6924 1.3450 1.7613 2.1448 2.6245 2.9768 15 0.6912 1.3406 1.7531 2.1315 2.6025 2.9467 16 0.6901 1.3368 1.7459 2.1199 2.5835 2.9208 17 0.6892 1.3334 1.7396 2.1098 2.5669 2.8982 18 0.6884 1.3304 1.7341 2.1009 2.5524 2.8784 19 0.6876 1.3277 1.7291 2.0930 2.5395 2.8609 20 0.6870 1.3253 1.7247 2.0860 2.5280 2.8453…n alpha=0.05 alpha=0.014 0.950 0.9905 0.878 0.9596 0.811 0.9177 0.754 0.8758 0.707 0.8349 0.666 0.79810 0.632 0.76511 0.602 0.73512 0.576 0.70813 0.553 0.68414 0.532 0.66115 0.514 0.64116 0.497 0.62317 0.482 0.60618 0.468 0.59019 0.456 0.57520 0.444 0.56121 0.433 0.54922 0.423 0.53723 0.413 0.52624 0.404 0.51525 0.396 0.50526 0.388 0.49627 0.381 0.48728 0.374 0.47929 0.367 0.47130 0.361 0.46335 0.334 0.43040 0.312 0.40345 0.294 0.38050 0.279 0.36155 0.266 0.34560 0.254 0.33065 0.244 0.31770 0.235 0.30675 0.227 0.29680 0.220 0.28685 0.213 0.27890 0.207 0.27095 0.202 0.263100 0.197 0.256