1 2 (a) -1 -2 0 1 2 -6 -113 77-7 77

Trigonometry (MindTap Course List)
10th Edition
ISBN:9781337278461
Author:Ron Larson
Publisher:Ron Larson
Chapter6: Topics In Analytic Geometry
Section6.4: Hyperbolas
Problem 5ECP: Repeat Example 5 when microphone A receives the sound 4 seconds before microphone B.

Related questions
Question
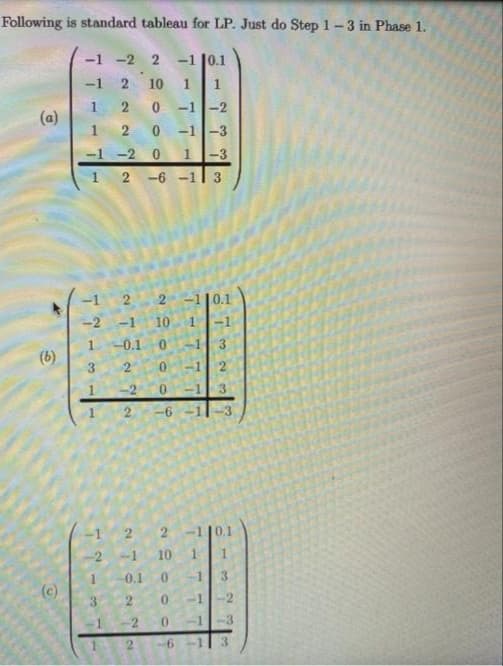
Transcribed Image Text:Following is standard tableau for LP. Just do Step 1-3 in Phase 1.
俄
-1
-2 2 -1 |0.1
-1
2
10
0 -1
-2
(a)
1
0 -1-3
2.
-1
-2 0
-3
1 2 -6 -1l 3
-1
2 -1|0.1
-2
-1
10
-1
1
-0.1 0
3.
(6)
3.
-2
-6
-1
2-110.1
-2
-1
10
0.1
-1
3.
3.
-1
2.
3.
7-777
17
1.
1.
(6)
Expert Solution
This question has been solved!
Explore an expertly crafted, step-by-step solution for a thorough understanding of key concepts.

Step by step
Solved in 5 steps

Knowledge Booster


Learn more about
Need a deep-dive on the concept behind this application? Look no further. Learn more about this topic, advanced-math and related others by exploring similar questions and additional content below.Recommended textbooks for you
Trigonometry (MindTap Course List)
Trigonometry
ISBN:
9781337278461
Author:
Ron Larson
Publisher:
Cengage Learning

College Algebra
Algebra
ISBN:
9781305115545
Author:
James Stewart, Lothar Redlin, Saleem Watson
Publisher:
Cengage Learning
Trigonometry (MindTap Course List)
Trigonometry
ISBN:
9781337278461
Author:
Ron Larson
Publisher:
Cengage Learning
College Algebra
Algebra
ISBN:
9781305115545
Author:
James Stewart, Lothar Redlin, Saleem Watson
Publisher:
Cengage Learning