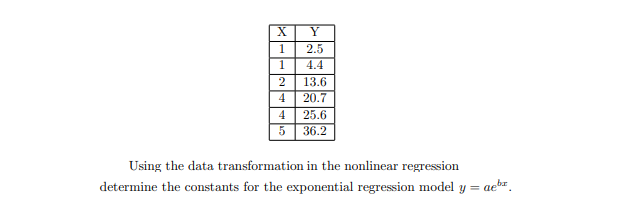
1 2.5 4.4 2 13.6 4 20.7 4 25.6 36.2 Using the data transformation in the nonlinear regression determine the constants for the exponential regression model y = aeb


Q: 3. Determine the equation of the exponential regression function for the data. Round all values to…
A:
Q: Verbal SAT as a Predictor of GPA A scatterplot with regression line is shown below for a regression…
A:
Q: sociologist wishes to study the relationship between happiness and age. He interviews 24 individuals…
A: Solution
Q: /2. A company wanted to assess the impact of R and D expenditure (X) on annual profit (Y). Following…
A:
Q: 17. What kind of Regression Model is illustrated in the picture below? E P>0 18. Which SPSS command…
A: Since you have asked multiple questions,we will solve the first question for you.If you want any…
Q: The accompanying data file contains 40 observations on the response variable y along with the…
A: a-1: Linear Regression: Excel Procedure: Enter X1, X2 and Y data in Excel Go to Data Click on Data…
Q: Production Volume (units) Total Cost ($) 400 4,000 450 5,000 550 5,400 600 5,900 700 6,400 750 7,000…
A: X Y X-Mx Y-My (X - Mx)2 (Y - My)2 (X - Mx)(Y - My) 400450550600700750 400050005400590064007000…
Q: 10.2.17 Listed below are systolic blood pressure measurements (in mm Hg) obtained from the same…
A: Given data, Right arm Left arm 102 176 101 169 94 146 75 145 75 146
Q: Verbal SAT as a Predictor of GPA A scatterplot with regression line is shown below for a regression…
A: Hi! Thank you for the question, As per the honor code, we are allowed to answer three sub-parts at a…
Q: (d) If the life expectancy is increased by 4 years in a certain country, how much will the happiness…
A: Provided information is ; regression line is y^ = a + b x where ; y = happiness index…
Q: 10.2.24 Question Help The data show the number of viewers for television stars with certain…
A: Use EXCEL to obtain the regression equation. EXCEL procedure: Go to EXCEL Go to Data>Data…
Q: The cost of attending your university/college has once again gone up. One of the administrators at…
A: Given:
Q: ) You are considering the relationship between annual returns on the S&P 500 index (January 31 to…
A: You define:S = annual % change in the S&P500 (SPX)U = annual % change in the unemployment…
Q: 1. For the data below, the coefficient of determination is : provide answer to 4 decimal places…
A:
Q: Question 1a Red wine, in moderation, has been thought of as heart healthy. Suppose that you want to…
A: Regression Analysis: A regression model is a statistical technique to predict an outcome or…
Q: 5.3 The data shown below present the average number of surviving bacteria in a canned food product…
A: Given data: Number of Bacteria Minutes of Exposure 175 1 108 2 95 3 82 4 71 5 50 6…
Q: 10.2.17 Question Help Listed below are systolic blood pressure measurements (in mm Hg) obtained from…
A: The following procedure is used to find out the regression equation for predicting the left arm…
Q: (a) Write down the simple linear regression model with necessary explanation of each term. (b)…
A: (a). The simple linear regression model is given as, y=a+bx Where, y is the dependent/response…
Q: You are considering the relationship between annual returns on the S&P 500 index (January 31 to…
A: Given, The slope of the regression line (b1) can be calculated by dividing the covariance of X and Y…
Q: Vitamin C grams content in mg 70 18.5 75 21.2 80 23 85 25.3 90 28.1 95 30.3 100 31.4 A) Find the…
A: Total number of observations of both grams of raspberries and expected vitamin C content, n = 7. Let…
Q: Designers of backpacks use exotic material to make packs that fit comfortably and distribute weight…
A: X1: Capacity X2: Rating y : Price As per our company guidelines we are supposed to answer only first…
Q: 30 60 90 120 150 7.9 A. 3.1 Usa technology to find a logistic regression curve y- 9.4 9.7 9.9…
A: Construct the table as follows-
Q: You work for a company in the marketing department. manager nas with forecasting sales by month for…
A: State the null hypotheses.
Q: What is the exponential regression of the data? x y -3 0.0740740740740741 -2 0.222222222222222 -1…
A: We know the formula for exponential regression is given as : y = a×bx by putting values of x and y…
Q: 100 12010003) Scatter diagram 1 S b. What does the scatter diagram developed in part (a) indicate…
A: For the given data Find ( d ) p value =? ( f ) blank = ?
Q: 3 4 5 7 7 7 8 9. y 4 5 4 6 4 6 9 11 Does there appear to be a linear relationship between x and y?…
A: *Answer:
Q: Which of the following is not an assumption of the regression model? The error terms have constant…
A: There are four main assumption for a linear regression model Linearity: model must show a linear…
Q: You are giving the regression equation of how the sales trend varies with time: y= 300 + 25x Where:…
A: Regression analysis is used to predict the value of dependent variable by using one or more…
Q: Owen invested $2 000 three years ago. He has been tracking the investment by recording its value at…
A: Let ' X ' represent the year number and ' Y ' be the value of the investment
Q: To identify high-paying jobs for people that do not like stress, the following data were collected…
A: Hello! As you have posted more than 3 sub parts, we are answering the first 3 sub-parts. In case…
Q: 1. |We wish to determine a regression equation that relates the length of an infant (in cm) to age…
A: *answer: *e Statistical significance: Since p-valueage (0.000475) < 0.01, it is concluded that…
Q: The table below shows the results of an experiment involving the growth of bacteria. Write a power…
A: Regression equation is used find the predicted value of response variable using the value of…
Q: One is curious about the relationship between wage and experience. Suppose that wage increases with…
A: Given two regression equations as wage=β0+β1experience+ui crime=β0+β1expenditure+ui
Q: M Gmail YouTube Maps JUN 15, 1. TL. TO PIT The accompanying table shows the number of bacteria…
A: .
Q: You estimate a regression equation Y= a+ b1X1 + 62X2+ b3X3 on a data set of 300 observatio:…
A: The regression analysis is a statistical procedure that allow us to find the linear association…
Q: What are the blanks?
A: Given,
Q: Forecast sales in the coming year (Year 5) using the regression results above.
A: The trend equation is given by S = -1.1t +110.9 where intercept is 110.9 and coefficient of year is…
Q: Question A sample consists of 500 houses sold in Karachi between January 2020 and December 2020. The…
A:
Q: Question 38. You have performed a linear regression analysis to explore sunflowers' growth (in…
A: If you give it an additional litre of water per day. there will be an additional average growth of…
Q: 1. An agent for a residential real estate company in a large city would like to be able to predict…
A: Linear regression attempts to model the relationship between two variables by fitting a linear…
Q: One is curious about the relationship between wage and experience. Suppose that wage increases with…
A: Regression analysis
Q: 10.2.22 Question Help The data show the bug chirps per minute at different temperatures. Find the…
A:
Q: Stoaches are fictional creatures that nest in truffula forests. A researcher wants to know…
A:
Q: 3. Determine the equation of the exponential regression function for the data. Round all values to…
A: Hi! Thank you for the question as per the honor code, we’ll answer the first question since the…
Q: toaches are fictional creatures that nest in truffula forests. A researcher wants to know whether…
A: Solution: The estimated regression equation is h^= -4.273+0.834 w n= 85 Sample size S.E(β1^)=…
Q: Suppose we fit a regression line t o predict the shelf life of an apple based on its weight. For a…
A: Solution: Predicted shelf life of an apple is 4.6 days. That is, y^ = 4.6 The apple's residual is…
Q: *5. Population The table shows the approximate populations of the United States for (116) certain…
A: We need to find population is 1950.
Q: 10.2.21-T Question Help Find the regression equation, letting the first variable be the predictor…
A: The provided data set is
Q: d. Determine the percentage of variation in the observed values of the response variable that is…
A: From the obtained results, the value of SST is 26 and the value of SSR is 2.

Step by step
Solved in 3 steps with 2 images

- What does the y -intercept on the graph of a logistic equation correspond to for a population modeled by that equation?Olympic Pole Vault The graph in Figure 7 indicates that in recent years the winning Olympic men’s pole vault height has fallen below the value predicted by the regression line in Example 2. This might have occurred because when the pole vault was a new event there was much room for improvement in vaulters’ performances, whereas now even the best training can produce only incremental advances. Let’s see whether concentrating on more recent results gives a better predictor of future records. (a) Use the data in Table 2 (page 176) to complete the table of winning pole vault heights shown in the margin. (Note that we are using x=0 to correspond to the year 1972, where this restricted data set begins.) (b) Find the regression line for the data in part ‚(a). (c) Plot the data and the regression line on the same axes. Does the regression line seem to provide a good model for the data? (d) What does the regression line predict as the winning pole vault height for the 2012 Olympics? Compare this predicted value to the actual 2012 winning height of 5.97 m, as described on page 177. Has this new regression line provided a better prediction than the line in Example 2?Table 6 shows the population, in thousands, of harbor seals in the Wadden Sea over the years 1997 to 2012. a. Let x represent time in years starting with x=0 for the year 1997. Let y represent the number of seals in thousands. Use logistic regression to fit a model to these data. b. Use the model to predict the seal population for the year 2020. c. To the nearest whole number, what is the limiting value of this model?
- The following fictitious table shows kryptonite price, in dollar per gram, t years after 2006. t= Years since 2006 0 1 2 3 4 5 6 7 8 9 10 K= Price 56 51 50 55 58 52 45 43 44 48 51 Make a quartic model of these data. Round the regression parameters to two decimal places.Consider a hypothetical regression predicting if someone will be married or not by the age of 40, MARRIED? (1 means this person is married by the age of 40 and 0 means this person is not married by the age of 40). The regression is as follows (all variables are statistically significant): MARRIED? = 0.2 + 0.03*EDUCATION - 0.01*BMI Where EDUCATION is the number of years of education someone's had and BMI is their body mass index. Suppose someone had 20 years of education and a BMI of 25. What is the predicted value of MARRIAGE? 0.35, which makes sense even though MARRIED? can only be a zero or one 0, because the calculated value is 0.35 so we round down. 0.55, which makes sense even though MARRIED? can only be a zero or one. Calculating a predicted value should not be done here because the dependent variable is a dummy variable. 1, because the calculated value is 0.55 so we round up.Consider a hypothetical regression predicting if someone will be married or not by the age of 40, MARRIED? (1 means this person is married by the age of 40 and 0 means this person is not married by the age of 40). The regression is as follows (all variables are statistically significant): MARRIED? = 0.2 + 0.03*EDUCATION - 0.01*BMI Where EDUCATION is the number of years of education someone's had and BMI is their body mass index. Suppose someone had 20 years of education and a BMI of 25. What is the predicted value of MARRIAGE? a 0, because the calculated value is 0.35 so we round down. b 0.55, which makes sense even though MARRIED? can only be a zero or one. c 0.35, which makes sense even though MARRIED? can only be a zero or one d Calculating a predicted value should not be done here because the dependent variable is a dummy variable. e 1, because the calculated value is 0.55 so we round up.
- Consider a hypothetical regression predicting if someone will be married or not by the age of 40, MARRIED? (1 means this person is married by the age of 40 and 0 means this person is not married by the age of 40). The regression is as follows (all variables are statistically significant): MARRIED? = 0.2 + 0.03*EDUCATION - 0.01*BMI Where EDUCATION is the number of years of education someone's had and BMI is their body mass index. Suppose someone had 20 years of education and a BMI of 25. Complete this sentence: For every additional year of education someone has:... a ...their chance of getting married by 40 increases by 0.03 percentage points. b ...their chance of getting married by 40 increases by 3 percentage points. c ...their chance of getting married by 40 increases by 0.03. d ...their chance of getting married by 40 increases by 3%. e This regression means nothing because the dependent variable is a dummy variable.Consider a hypothetical regression predicting if someone will be married or not by the age of 40, MARRIED? (1 means this person is married by the age of 40 and 0 means this person is not married by the age of 40). The regression is as follows (all variables are statistically significant): MARRIED? = 0.2 + 0.03*EDUCATION - 0.01*BMI Where EDUCATION is the number of years of education someone's had and BMI is their body mass index. Suppose someone had 20 years of education and a BMI of 25.When is a variable in a regression statistically significant? 1 When p is more than alpha. 2 When p is more than R2. 3 When p is less than alpha. 4 When p is less than R2. 5 When p is less than the coefficient.
- Consider the following sample regression equation yˆ = 150 − 20x, where y is the demand for Product A (in 1,000s) and x is the price of the product (in $). The slope coefficient indicates that if _____Suppose that R2= 1 for a data set. What can you say abota. SSE? b. SSR? c. the utility of the sample multiple linear regression equation for making predictions?The certain study seeks to investigate whether negative life events, family environment, family violence, media violence, and depression are predictors of youth aggression and bullying. Which of the following statistical tests is most appropriate to answer this objective? a. Linear Regression b. McNemar's Test c. Chi-square Test d. Multiple Logistic Regression


