1) Find the sample mean and sample standard deviation for the floor exercise scores in the Individual Female All-Around Finals Gymnastics Data (2).xlsx (copy and paste link) (if it doesn't work, the data is below in the table) 15 14.85 15.2 14.25 13.85 13 13.6 13.7 14.05 12.7 14.05 13.65 13.25 13.25 13.55 12.95 13.55 13.05 11.85 13.2 11 13.8 12.25 12.1 12.1 11.6 11.9 12.05 10.75 11.2 10.55 11.1 10.45 9.6 13.85 14.25 14.8 14 14.5 13.75 13.55 12.55 13.2 13.7 13.35 13.25 12.95 13.4 13.35 13.3 12.3 13.55 12.8 12.4 13.1 12.3 12.6 12.65 11.9 10.2 12.05 11.7 10.4 10.75 9.8 9.6 10.75 9.75 9.55 9.05 14.65 14.2 15.35 14.6 14.3 14.75 13.65 13.7 14.25 13.8 14.1 13.6 14 14.25 13.2 14.4 13.25 13.7 13.15 13.05 13.45 12.4 13.3 12.75 12.2 12.6 11.55 11.6 11.6 10 10.9 10.35 11.75 11.3 10.3 10.9
1) Find the sample mean and sample standard deviation for the floor exercise scores in the Individual Female All-Around Finals Gymnastics Data (2).xlsx (copy and paste link) (if it doesn't work, the data is below in the table) 15 14.85 15.2 14.25 13.85 13 13.6 13.7 14.05 12.7 14.05 13.65 13.25 13.25 13.55 12.95 13.55 13.05 11.85 13.2 11 13.8 12.25 12.1 12.1 11.6 11.9 12.05 10.75 11.2 10.55 11.1 10.45 9.6 13.85 14.25 14.8 14 14.5 13.75 13.55 12.55 13.2 13.7 13.35 13.25 12.95 13.4 13.35 13.3 12.3 13.55 12.8 12.4 13.1 12.3 12.6 12.65 11.9 10.2 12.05 11.7 10.4 10.75 9.8 9.6 10.75 9.75 9.55 9.05 14.65 14.2 15.35 14.6 14.3 14.75 13.65 13.7 14.25 13.8 14.1 13.6 14 14.25 13.2 14.4 13.25 13.7 13.15 13.05 13.45 12.4 13.3 12.75 12.2 12.6 11.55 11.6 11.6 10 10.9 10.35 11.75 11.3 10.3 10.9

MATLAB: An Introduction with Applications
6th Edition
ISBN:9781119256830
Author:Amos Gilat
Publisher:Amos Gilat
Chapter1: Starting With Matlab
Section: Chapter Questions
Problem 1P

Related questions
Question
1) Find the sample mean and sample standard deviation for the floor exercise scores in the Individual Female All-Around Finals
- Gymnastics Data (2).xlsx (copy and paste link) (if it doesn't work, the data is below in the table)
| 15 |
| 14.85 |
| 15.2 |
| 14.25 |
| 13.85 |
| 13 |
| 13.6 |
| 13.7 |
| 14.05 |
| 12.7 |
| 14.05 |
| 13.65 |
| 13.25 |
| 13.25 |
| 13.55 |
| 12.95 |
| 13.55 |
| 13.05 |
| 11.85 |
| 13.2 |
| 11 |
| 13.8 |
| 12.25 |
| 12.1 |
| 12.1 |
| 11.6 |
| 11.9 |
| 12.05 |
| 10.75 |
| 11.2 |
| 10.55 |
| 11.1 |
| 10.45 |
| 9.6 |
| 13.85 |
| 14.25 |
| 14.8 |
| 14 |
| 14.5 |
| 13.75 |
| 13.55 |
| 12.55 |
| 13.2 |
| 13.7 |
| 13.35 |
| 13.25 |
| 12.95 |
| 13.4 |
| 13.35 |
| 13.3 |
| 12.3 |
| 13.55 |
| 12.8 |
| 12.4 |
| 13.1 |
| 12.3 |
| 12.6 |
| 12.65 |
| 11.9 |
| 10.2 |
| 12.05 |
| 11.7 |
| 10.4 |
| 10.75 |
| 9.8 |
| 9.6 |
| 10.75 |
| 9.75 |
| 9.55 |
| 9.05 |
| 14.65 |
| 14.2 |
| 15.35 |
| 14.6 |
| 14.3 |
| 14.75 |
| 13.65 |
| 13.7 |
| 14.25 |
| 13.8 |
| 14.1 |
| 13.6 |
| 14 |
| 14.25 |
| 13.2 |
| 14.4 |
| 13.25 |
| 13.7 |
| 13.15 |
| 13.05 |
| 13.45 |
| 12.4 |
| 13.3 |
| 12.75 |
| 12.2 |
| 12.6 |
| 11.55 |
| 11.6 |
| 11.6 |
| 10 |
| 10.9 |
| 10.35 |
| 11.75 |
| 11.3 |
| 10.3 |
| 10.9 |
2) Find the sample mean and sample standard deviation for the floor exercise scores in the Individual Male All-Around Finals.
- Gymnastics Data (2).xlsx (copy and paste link)
| 13.55 |
| 13.75 |
| 13.5 |
| 14.25 |
| 13.35 |
| 13.85 |
| 13.5 |
| 13.1 |
| 12.8 |
| 12.35 |
| 13.25 |
| 10.6 |
| 12.6 |
| 13.35 |
| 13.5 |
| 13.55 |
| 12.9 |
| 11.8 |
| 13.05 |
| 13.4 |
| 12.05 |
| 11.05 |
| 11.8 |
| 11.8 |
| 11.9 |
| 12.35 |
| 12.5 |
| 12.35 |
| 11.95 |
| 12.05 |
| 11.6 |
| 10.9 |
| 12.5 |
| 12.05 |
| 13 |
| 13.6 |
| 13.8 |
| 12.55 |
| 12.8 |
| 12 |
| 13.5 |
| 12.05 |
| 13.15 |
| 13.25 |
| 11.8 |
| 12.75 |
| 12.35 |
| 12.75 |
| 12.2 |
| 12.85 |
| 12.45 |
| 12.7 |
| 12.55 |
| 12.35 |
| 12.25 |
| 12.45 |
| 13 |
| 12.05 |
| 12 |
| 12.5 |
| 12.2 |
| 12.25 |
| 11.85 |
| 11.95 |
| 11.5 |
| 11.5 |
| 9.7 |
| 10.55 |
| 10 |
| 12.1 |
| 12.85 |
| 12.65 |
| 12.9 |
| 11.8 |
| 12.9 |
| 12.45 |
| 11.95 |
| 12.1 |
| 11.8 |
| 12.35 |
| 12.1 |
| 12 |
| 11.85 |
| 12.2 |
| 11.7 |
| 12.15 |
| 11.3 |
| 11.3 |
| 12.4 |
| 12 |
| 12 |
| 11.45 |
| 11 |
| 10.85 |
| 11.25 |
| 10.6 |
| 10.5 |
| 10.1 |
| 11 |
| 11 |
| 10.85 |
| 10.35 |
| 10.2 |
| 11.05 |
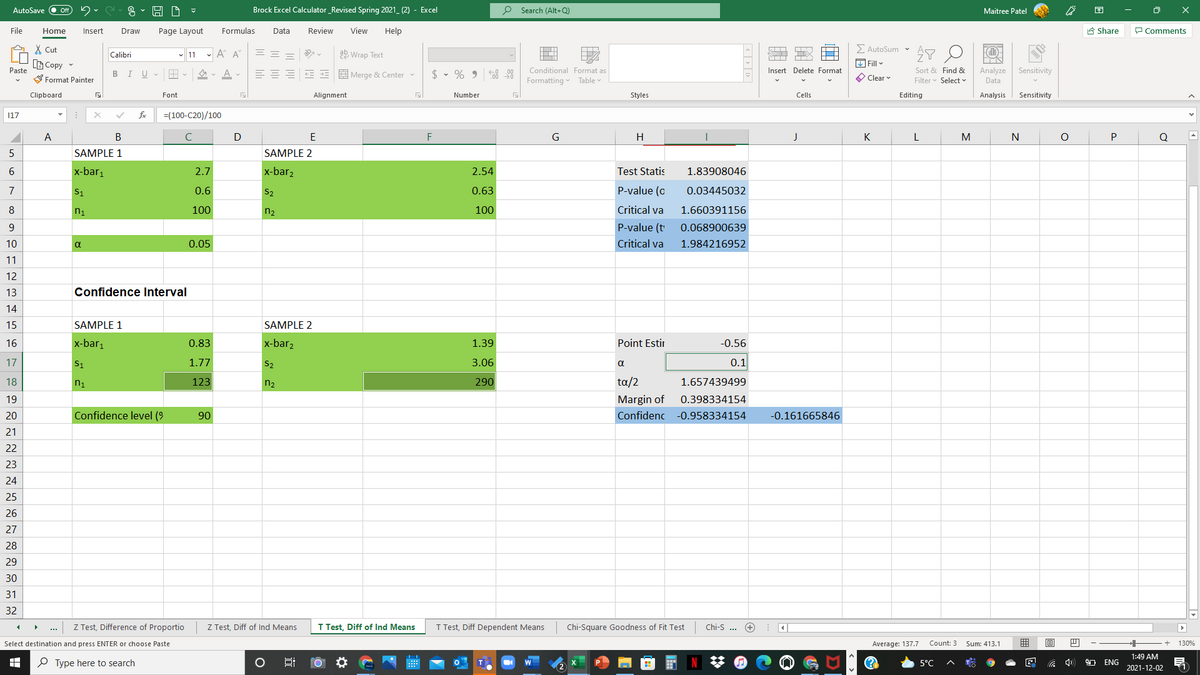
3) Construct a 95% confidence interval for the difference in population mean floor exercise scores between female and male gymnasts in the Individual All-Around Finals. (Hint: Use the results of 1) and 2) and use the t-distribution.)
(IMAGE - is for question 3, an example on conducting the confidence interval)
Transcribed Image Text:AutoSave O ff
Brock Excel Calculator _Revised Spring 2021_ (2) - Excel
o Search (Alt+Q)
Maitree Patel
File
Home
Insert
Draw
Page Layout
Formulas
Data
Review
View
Help
A Share
P Comments
X Cut
- 11 - A A
ab Wrap Text
> AutoSum r
Calibri
B Copy
Fill -
Sort & Find &
Filter v Select v
Paste
в IU
=E E E E E Merge & Center -
$ • % 9
Conditional Format as
Insert Delete Format
Analyze
Sensitivity
S Format Painter
Formatting
Table v
O Clear
Data
Clipboard
Font
Alignment
Number
Styles
Cells
Editing
Analysis
Sensitivity
17
fe
=(100-C20)/100
A
В
C
D
E
G
H
K
M
P
SAMPLE 1
SAMPLE 2
6.
x-barı
2.7
x-bar2
2.54
Test Statis
1.83908046
7
S1
0.6
S2
0.63
P-value (o
0.03445032
8
n1
100
n2
100
Critical va
1.660391156
9
P-value (t
0.068900639
10
a
0.05
Critical va
1.984216952
11
12
13
Confidence Interval
14
15
SAMPLE 1
SAMPLE 2
16
x-bar1
0.83
x-bar,
1.39
Point Estir
-0.56
17
S1
1.77
3.06
a
0.1
18
n1
123
n2
290
ta/2
1.657439499
19
Margin of
0.398334154
20
Confidence level (9
90
Confidenc
-0.958334154
-0.161665846
21
22
23
24
25
26
27
28
29
30
31
32
Z Test, Difference of Proportio
Z Test, Diff of Ind Means
T Test, Diff of Ind Means
T Test, Diff Dependent Means
Chi-Square Goodness of Fit Test
Chi-S ...
Average: 137.7
Count: 3
囲
Select destination and press ENTER or choose Paste
Sum: 413.1
130%
1:49 AM
P Type here to search
N
O ENG
T
5°C
2021-12-02
远
Expert Solution
This question has been solved!
Explore an expertly crafted, step-by-step solution for a thorough understanding of key concepts.

This is a popular solution!

Trending now
This is a popular solution!

Step by step
Solved in 4 steps

Recommended textbooks for you
MATLAB: An Introduction with Applications
Statistics
ISBN:
9781119256830
Author:
Amos Gilat
Publisher:
John Wiley & Sons Inc

Probability and Statistics for Engineering and th…
Statistics
ISBN:
9781305251809
Author:
Jay L. Devore
Publisher:
Cengage Learning

Statistics for The Behavioral Sciences (MindTap C…
Statistics
ISBN:
9781305504912
Author:
Frederick J Gravetter, Larry B. Wallnau
Publisher:
Cengage Learning
MATLAB: An Introduction with Applications
Statistics
ISBN:
9781119256830
Author:
Amos Gilat
Publisher:
John Wiley & Sons Inc
Probability and Statistics for Engineering and th…
Statistics
ISBN:
9781305251809
Author:
Jay L. Devore
Publisher:
Cengage Learning
Statistics for The Behavioral Sciences (MindTap C…
Statistics
ISBN:
9781305504912
Author:
Frederick J Gravetter, Larry B. Wallnau
Publisher:
Cengage Learning

Elementary Statistics: Picturing the World (7th E…
Statistics
ISBN:
9780134683416
Author:
Ron Larson, Betsy Farber
Publisher:
PEARSON

The Basic Practice of Statistics
Statistics
ISBN:
9781319042578
Author:
David S. Moore, William I. Notz, Michael A. Fligner
Publisher:
W. H. Freeman

Introduction to the Practice of Statistics
Statistics
ISBN:
9781319013387
Author:
David S. Moore, George P. McCabe, Bruce A. Craig
Publisher:
W. H. Freeman