1. According to a report published by Gallup Institute on February 20, 2020, based on the interview that took place between February 3 and February 16, 77% of 1,028 randomly selected American adults felt they were generally confident in the federal government's ability to handle a potential corona-virus outbreak. Find the 98% confidence interval.
1. According to a report published by Gallup Institute on February 20, 2020, based on the interview that took place between February 3 and February 16, 77% of 1,028 randomly selected American adults felt they were generally confident in the federal government's ability to handle a potential corona-virus outbreak. Find the 98% confidence interval.

College Algebra (MindTap Course List)
12th Edition
ISBN:9781305652231
Author:R. David Gustafson, Jeff Hughes
Publisher:R. David Gustafson, Jeff Hughes
Chapter8: Sequences, Series, And Probability
Section8.7: Probability
Problem 58E: What is meant by the sample space of an experiment?

Related questions
Topic Video
Question
Can you answer question #1 and #2?
Transcribed Image Text:ZOOM +
Name:
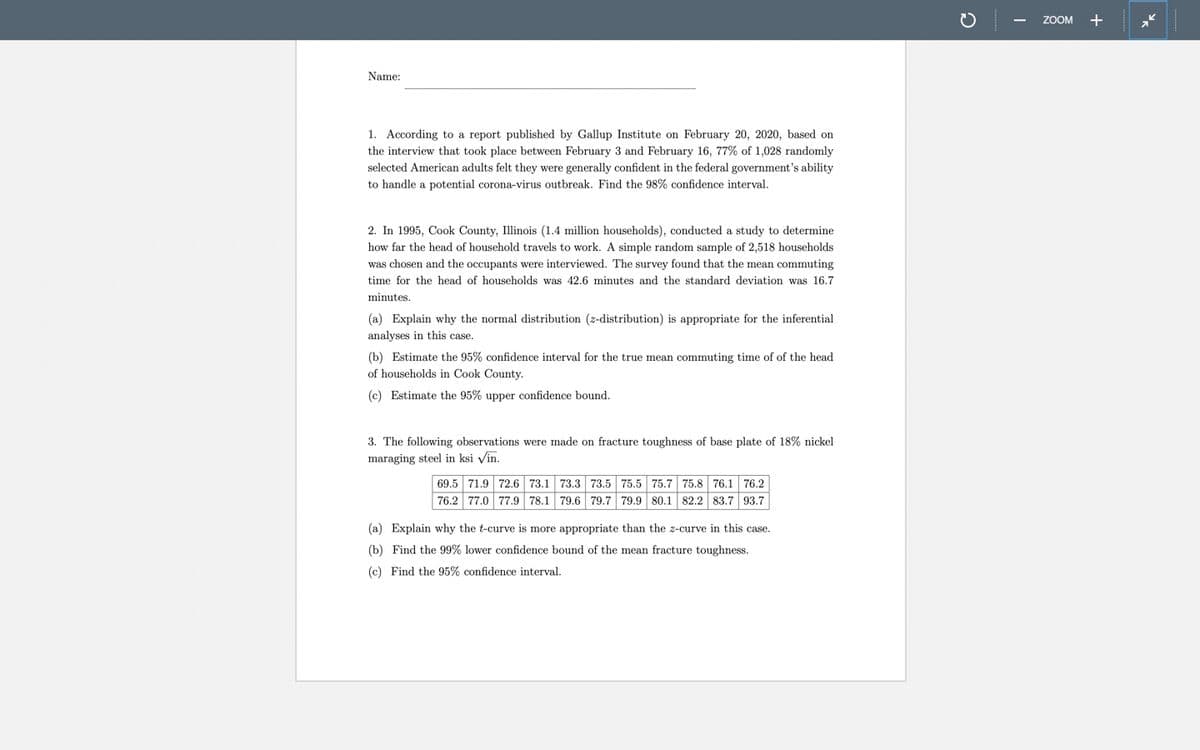
1. According to a report published by Gallup Institute on February 20, 2020, based on
the interview that took place between February 3 and February 16, 77% of 1,028 randomly
selected American adults felt they were generally confident in the federal government's ability
to handle a potential corona-virus outbreak. Find the 98% confidence interval.
2. In 1995, Cook County, Illinois (1.4 million households), conducted a study to determine
how far the head of household travels to work. A simple random sample of 2,518 households
was chosen and the occupants were interviewed. The survey found that the mean commuting
time for the head of households was 42.6 minutes and the standard deviation was 16.7
minutes.
(a) Explain why the normal distribution (z-distribution) is appropriate for the inferential
analyses in this case.
(b) Estimate the 95% confidence interval for the true mean commuting time of of the head
of households in Cook County.
(c) Estimate the 95% upper confidence bound.
3. The following observations were made on fracture toughness of base plate of 18% nickel
maraging steel in ksi Vin.
69.5 71.9 72.6 73.1 73.3 73.5 75.5 75.7 75.8 76.1 76.2
76.2 77.0 77.9 78.1 79.6 79.7 79.9 80.1 82.2 83.7 93.7
(a) Explain why the t-curve is more appropriate than the z-curve in this case.
(b) Find the 99% lower confidence bound of the mean fracture toughness.
(c) Find the 95% confidence interval.
Transcribed Image Text:Page
1
> of 2
ZOOM +
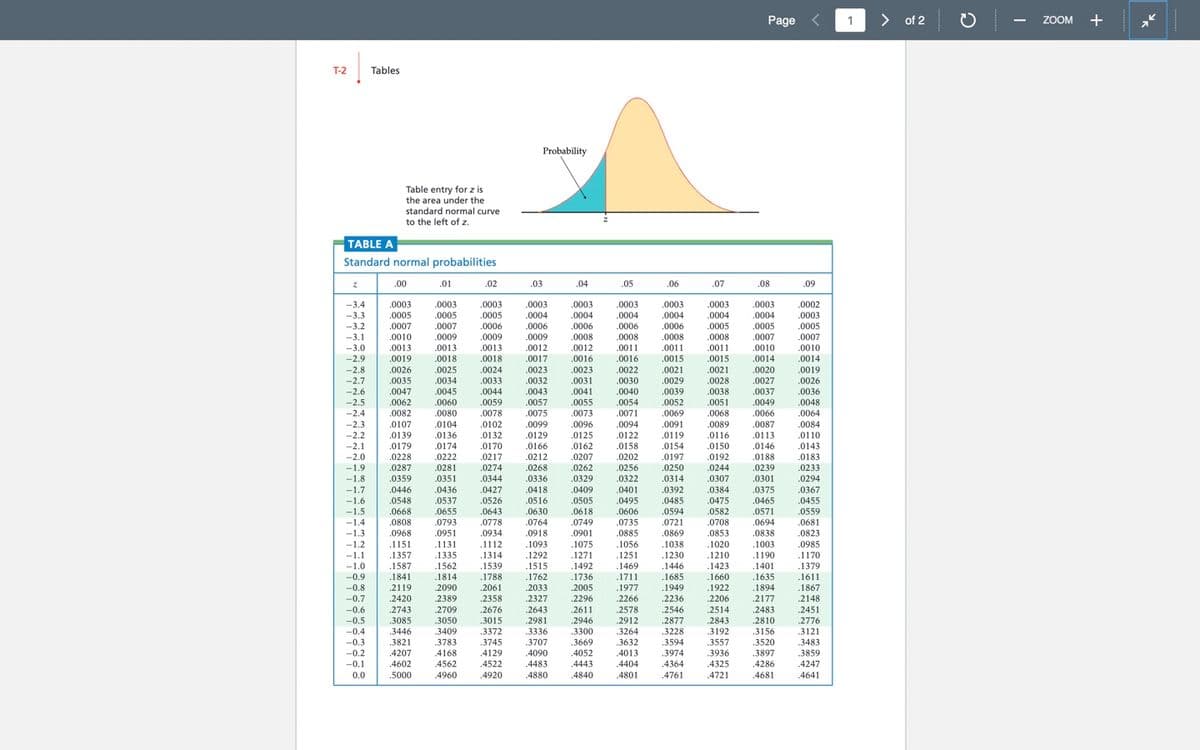
T-2
Tables
Probability
Table entry for z is
the area under the
standard normal curve
to the left of z.
TABLE A
Standard normal probabilities
.00
.01
.02
.03
.04
.05
.06
.07
.08
.09
-3.4
.0003
.0003
.0003
.0003
.0003
.0003
.0003
.0003
.0003
.0002
-3.3
.0005
.0007
.0005
.0007
.0005
.0004
.0004
.0004
.0004
.0004
.0004
.0005
.0007
.0003
-3.2
.0006
.0006
.0006
.0008
.0006
.0008
.0011
.0016
.0006
.0008
.0005
.0005
-3.1
.0010
.0009
.0009
.0009
.0008
.0007
0013
.0011
.0015
.0010
.0014
-3.0
.0013
.0019
.0013
.0012
.0012
.0011
.0010
-2.9
-2.8
.0018
.0018
.0017
.0016
.0015
.0014
.0019
.0026
.0026
.0025
.0024
.0023
.0023
.0022
.0021
.0021
.0020
.0030
.0040
-2.7
.0035
.0034
.0033
.0032
.0031
.0029
.0028
0027
-2.6
.0047
.0045
.0044
.0043
.0041
.0039
.0038
.0037
.0036
-2.5
.0062
.0060
.0059
.0057
.0055
.0054
.0052
.0051
.0049
.0048
-2.4
.0082
.0080
.0078
.0075
.0073
.0071
.0069
.0068
.0066
.0064
-2.3
-2.2
.0107
.0139
.0179
.0089
.0116
.0104
.0102
.0099
.0096
.0094
.0091
.0087
.0084
.0136
.0132
.0129
.0125
.0122
.0119
.0113
.0110
-2.1
.0174
.0170
.0166
.0162
.0158
.0154
.0150
.0146
.0143
-2.0
-1.9
.0228
.0222
.0217
.0212
.0207
.0262
.0202
.0197
.0192
.0188
.0239
.0301
.0183
.0233
.0294
.0268
.0287
.0359
.0281
.0274
.0256
.0250
.0314
.0244
-1.8
.0351
.0344
.0336
.0329
.0322
.0307
-1.7
.0446
.0436
.0427
.0418
.0409
.0401
.0392
.0384
.0375
.0367
-1.6
-1.5
.0548
.0537
.0526
.0516
.0505
.0495
.0485
.0475
.0465
.0455
.0668
.0655
.0643
.0630
.0618
.0606
.0594
.0582
.0571
.0559
-1.4
.0808
.0793
.0778
.0764
.0749
.0735
.0721
.0708
.0694
.0681
-1.3
.0968
.0951
.0934
.0918
.0901
.0885
.0869
.0853
.0838
.0823
-1.2
.1151
.1131
.1112
.1093
.1075
.1056
.1038
.1020
.1003
.0985
-1.1
.1357
.1335
.1314
.1292
.1271
.1492
.1251
.1230
.1210
.1190
.1401
.1170
.1587
.1841
.1446
.1685
-1.0
.1562
.1539
.1515
.1469
.1423
.1379
-0.9
.1814
.1788
.1762
.1736
.1711
.1660
.1635
.1611
-0.8
-0.7
-0.6
.2119
.2090
.2061
.2033
.2005
.1977
.1949
.1922
.1894
.1867
.2177
.2483
.2420
2389
.2358
.2676
.2327
.2296
.2266
.2236
.2206
.2148
2643
.2578
.2912
.2546
2514
.2843
.3192
.3557
.2743
2709
.2611
.2451
.2981
.2877
-0.5
-0.4
-0.3
-0.2
-0.1
3085
.3050
.3015
.2946
.2810
.2776
.3409
.3372
.3336
3228
3594
3446
.3300
.3264
.3156
3121
3821
3783
.3745
.3707
.3669
.3632
.3520
.3897
.4286
.3483
.4207
.4168
.4129
.4090
.4052
.4013
.3974
.3936
.3859
4602
4562
.4522
.4483
.4443
.4404
.4364
.4325
.4247
0.0
.5000
.4960
.4920
.4880
.4840
.4801
.4761
.4721
.4681
.4641
Expert Solution
This question has been solved!
Explore an expertly crafted, step-by-step solution for a thorough understanding of key concepts.

Step by step
Solved in 3 steps with 3 images

Knowledge Booster


Learn more about
Need a deep-dive on the concept behind this application? Look no further. Learn more about this topic, probability and related others by exploring similar questions and additional content below.Recommended textbooks for you
College Algebra (MindTap Course List)
Algebra
ISBN:
9781305652231
Author:
R. David Gustafson, Jeff Hughes
Publisher:
Cengage Learning
College Algebra (MindTap Course List)
Algebra
ISBN:
9781305652231
Author:
R. David Gustafson, Jeff Hughes
Publisher:
Cengage Learning