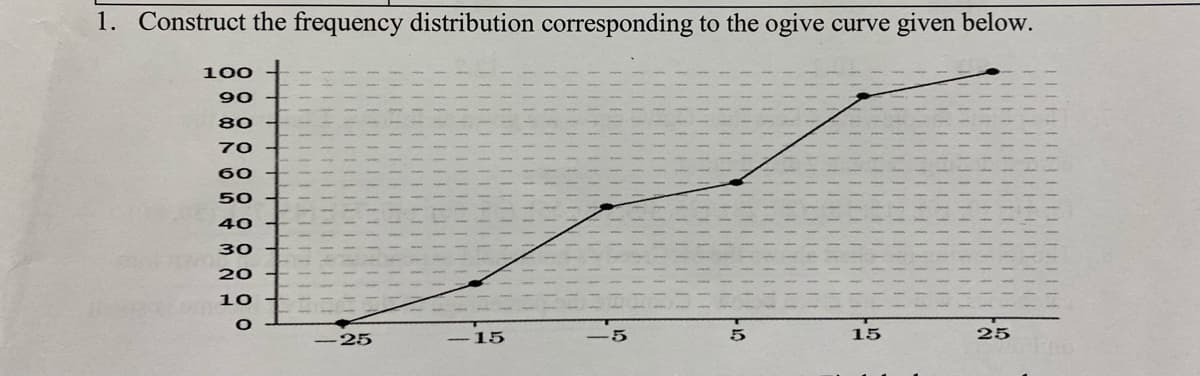
1. Construct the frequency distribution corresponding to the ogive curve given below. 100 90 80 70 60 50 40 30 20 10 -25 -15 15 25


Q: particular
A:
Q: 3. Find A.M. from the following frequency distribution. Wages No. of workers 100 120 140 160 180 200…
A:
Q: Find the median for the given frequency distribution. O A. 2.5 VatueFrequency 8. О В. 4 ОС. 3.5 12…
A: Given:
Q: 3. Find A.M. from the following frequency distribution. Wages 100 120 140 160 No. of workers 4 8 12…
A:
Q: A Quick-Change Oil company has a number of outlets. The numbers of oil changes at the 2nd street…
A: Note: According to Bartleby guidelines, expert solve only one question and maximum 3 subpart of the…
Q: Calculate the median for the following frequency distribution: Marks No. of Students Marks No. of…
A: Given data is Marks No. of students 05-10 7 10-15 12 15-20 24 20-25 31 25-30 42 30-35…
Q: You are given the following frequency distribution, Class Frequency 10 – 19 12 20 – 29 19 - 30 – 39…
A: The given frequency distribution is, Class Frequency 10-19 12 20-29 19 30-39 24 40-49 35
Q: The data shown here represent the number of miles per gallon that 40 selected four-wheel-drive…
A: # We are entitled to solve one question at a time please resubmit the other question if you wish to…
Q: Prepare a frequency distribution table with a column for intervals and frequencies. Use five…
A: Prepare a frequency distribution table with a column for intervals and frequencies. Use five…
Q: III. The data represent the ages of Presidents at the time they were first inaugurated. 57 61 57 57…
A: A histogram is used to understand the distribution of the data. In a histogram, the x-axis values…
Q: Name and explain everything wrong with the following grouped frequency distribution table. f 12-21…
A: a) The heading of the first column should be class interval instead of X. Class interval F p…
Q: Consider the following data set. The annual wages of employees at a small accounting firm are given…
A: Solution: The given data set is 25, 25, 30, 30, 35, 35, 50, 60, 16, 14, 18, 18 and 20.
Q: 12. FILE The Quick Change Oil Company has a number of outlets in the metropolitan Seat- tle area.…
A: Since you have posted a question with multiple sub parts, according to our guidelines we can solve…
Q: Approximate the mean of the frequency distribution for the ages of the residents of a town. Age…
A:
Q: Find the median from the grouped frequency distribution table. Class Frequency (f) (X) 0-10 10 11-21…
A:
Q: The data shown here represent the number of miles per gallon that 40 selected four-wheel-drive…
A: we have, data represent the number of miles per gallon that 40 selected four-wheel drive spots…
Q: Length of a Walk (in Miles) Class 0.34-0.40 0.41-0.47 Frequency 7 13
A: Formula used for midpoint . (upper class + lower class)/2
Q: Draw a cumulative frequency curve for the following data : Marks No. of students Marks No. of…
A:
Q: Consider the following frequency distribution. Class Midpoint Frequency 0 - 9 4.5 2 10 – 19 14.5 8.…
A:
Q: Consider the following frequency table representing the distribution of hours students study for an…
A: Lower class boundary for the fifth class = ?
Q: Construct one table that includes relative frequencies based on the frequency distributions shown…
A:
Q: Find the median from the grouped frequency distribution table. Class Frequency (X) (f) 0-10 10 11-21…
A: The data given is as follows X Frequency 0-10 10 11 -21 30 22-31 43 32-41 83 42-51 190…
Q: 3. Listed below are the speeds from 30 random speeding tickets in Denver over the last week. Create…
A: Provided information is; number of observations(N) = 30 Given data is ; 48 92 50 29 40 129 43 108…
Q: For the variable “Age”, construct a frequency distribution. b. Draw an appropriate graph to…
A: Data on the ages of students in a local sociology graduate program is given: Student Age…
Q: Find the median for the data items in the given frequency distribution 1 2 3 5 6 7 Score, x…
A: Using median online calculator
Q: Approximate the mean of the frequency distribution for the ages of the residents of a town. Age…
A:
Q: Complete the given frequency distribution table to find the mean, median and mode. Write their…
A:
Q: You are given the following frequency distribution. Class Frequency 10 – 19 12 20 – 29 19 30 – 39 24…
A: Number of elements means total sample size Or n means the sum of frequency will be the number of…
Q: | 21 22 / 2 Illustration 6.8. Prepare a bivariate frequency distribution for the following data:…
A:
Q: For the following frequency distribution, what is EX? f 60-64 55-59 11 50-54 8 45-49 40-44 6 O 39 O…
A:
Q: The following data show the method of payment by 16 customers in a supermarket checkout line. Here,…
A: Given - The 16 supermarket checkout line . 1. To find frequency table 2. To find Relative Frequency…
Q: Given the following frequency distribution, calculate the relative frequency of Red. Color of m&m's…
A:
Q: 1. The following data represents the heart beat rate, in bpm, of patients in a hospital. (a) Create…
A: Frequency : The number of times a data occurs in a data set is known as the frequency of data.…
Q: 2- The ages of the Vice Presidents of the United States at the time of their death are listed below.…
A:
Q: Name and explain everything wrong with the following grouped frequency distribution table. 12-21…
A: a) Use the term "Class interval" instead of "X" in the heading of the first column. Class…
Q: 2. Here are the scores on the first exam in an introductory statistics course for 30 students in one…
A:
Q: Construct the relative frequency distribution that corresponds to the given frequency distribution.…
A:
Q: The following cumulative frequency curve shows the distribution of speeds of 60 cars. 60 Cumulative…
A: From the given information, Consider, Sample size (N) = 60 .In other words, total frequency =60…
Q: The following cumulative frequency curve shows the distribution of speeds of 60 cars. 60 Cumulative…
A: From the given information, Consider, The total cars (CF) = 60, Thus,
Q: Refer to the table below that shows the frequency distribution of the heights of 45 SHS students.…
A:
Q: 8. Find the Men, Mode and Median for A) the given frequency distribution table 6. 10 4. 3. 1
A:
Q: 6. Below is a frequency distribution. Classes 0-14 4. 15-29 18 30-44 12
A: (a) - Mean deviation : Mean ˉx∑fx/∑f =1649/47 =35.0851 Class(1) f(2) Mid value…
Q: Example Obtain the median for the following frequency distribution : 6 x: 1 2 3 4 7 8 9. f: 8 10 11…
A:
Q: III. The data represent the ages of Presidents at the time they were first inaugurated. 57 61 57 57…
A: g) According to the provided information, the age of the youngest President is 46. 46 is the…
Q: Complete the frequency distribution for the data.
A: Our aim is to complete the frequency distribution for the data
Q: The following data give the time (in minutes) taken to commute from home to work for nurses. 10 50…
A: The two endpoints of a class interval used for tally marking are called the class limits. These…
Q: Find the mean of the data summarized in the given frequency distribution. 12) The highway speeds of…
A: Mean for grouped data:The formula to find mean for grouped data is as follows:
Q: simplify the data.
A: A frequency distribution displays various outcomes in a sample. Frequency indicates the number of…
Q: Complete the frequency distribution table for the data given in the graph: O 5 20 25 0 Class limits…
A: We can find the answer from frequency distribution

Step by step
Solved in 2 steps
