1. GRAPHICAL ANALYSIS: MOTION /STRUCTURED Analysis Questions O 1. One of the three types of motion you explored was constant velocity, but was the velocity of the cart totally constant during your trials or did it slow down or speed up slightly? What are some factors that may have caused the velocity of the cart not to be constant? heveloty was coutantduring le drinla. Sactors dhat oud manipulale Me valoady wauld le Aidta.fcar dhes,graitaloal force, o O 2. Another type of motion you explored was constant acceleration. What caused the constant acceleration of the cart? How could you have increased this acceleration, and how would your graphs of position and velocity versus time be different if the acceleration was greater? O 3. Another student moved a Smart Cart with their hand back and forth across the track. Assuming the graph below shows this data, describe the motion of the cart during data collection in terms of its speed and direction,
1. GRAPHICAL ANALYSIS: MOTION /STRUCTURED Analysis Questions O 1. One of the three types of motion you explored was constant velocity, but was the velocity of the cart totally constant during your trials or did it slow down or speed up slightly? What are some factors that may have caused the velocity of the cart not to be constant? heveloty was coutantduring le drinla. Sactors dhat oud manipulale Me valoady wauld le Aidta.fcar dhes,graitaloal force, o O 2. Another type of motion you explored was constant acceleration. What caused the constant acceleration of the cart? How could you have increased this acceleration, and how would your graphs of position and velocity versus time be different if the acceleration was greater? O 3. Another student moved a Smart Cart with their hand back and forth across the track. Assuming the graph below shows this data, describe the motion of the cart during data collection in terms of its speed and direction,

Related questions
Question
Please answer the following question and sketch the graph and explain it. Please answer as soon as possible. I will be very thankful to you. God bless you
Transcribed Image Text:1. GRAPHICAL ANALYSIS: MOTION/STRUCTURED
Analysis Questions
O 1. One of the three types of motion you explored was constant velocity, but was the velocity of the
cart totally constant during your trials or did it slow down or speed up slightly? What are some
factors that may have caused the velocity of the cart not to be constant?
the veloeity wai couskantiduring Me handi. Sucbirs hat cold mmanipulate
Me veloady would le htettanf car dhes garitalioal force, e
O 2. Another type of motion you explored was constant acceleration. What caused the constant
acceleration of the cart? How could you have increased this acceleration, and how would your
graphs of position and velocity versus time be different if the acceleration was greater?
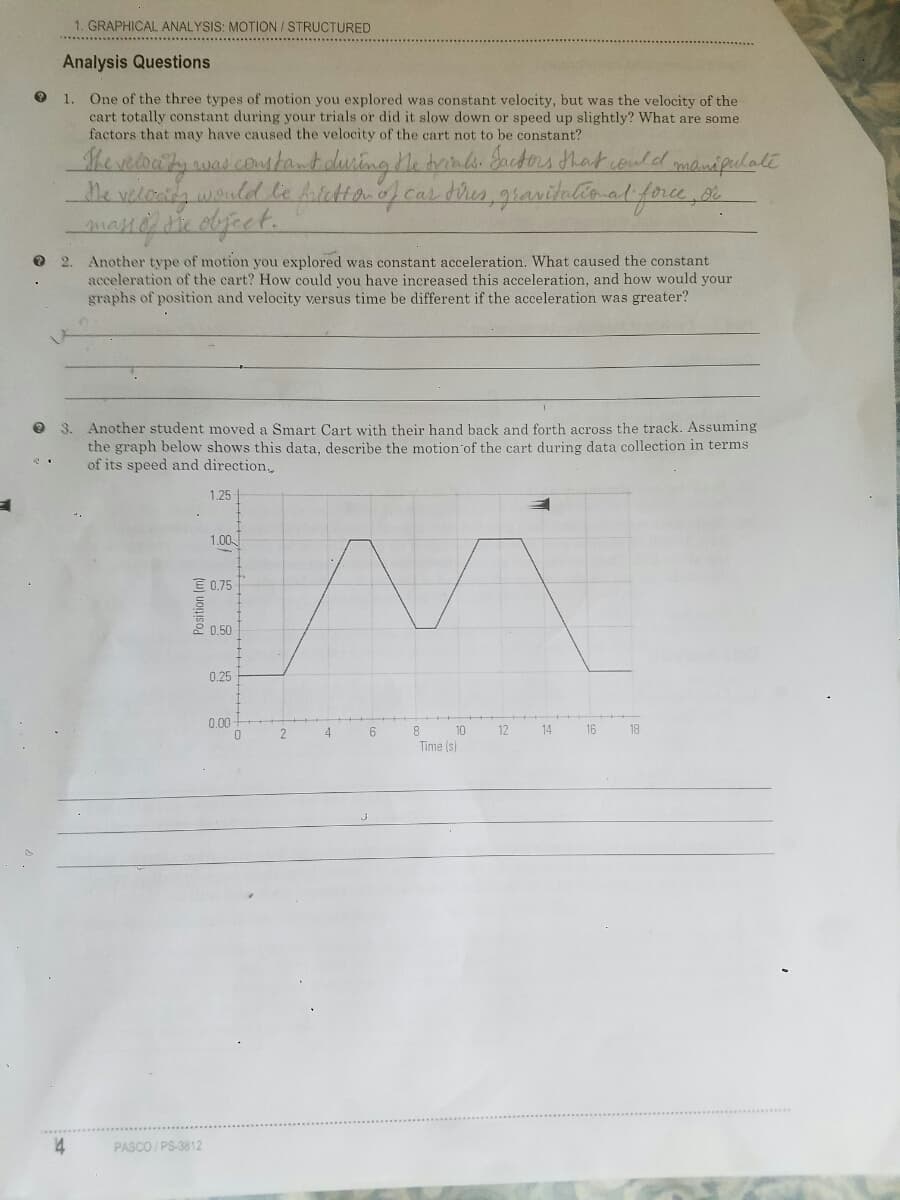
O 3. Another student moved a Smart Cart with their hand back and forth across the track. Assuming
the graph below shows this data, describe the motion of the cart during data collection in terms
of its speed and direction,
1.25
1.00
E 0.75
2 0.50
0.25
0.00-
8
10
12
14
16
18
Time (s)
PASCO/ PS-3812
Position (m)
Transcribed Image Text:GRAPHICAL ANALYSIS: MOTION / STRUCTURED
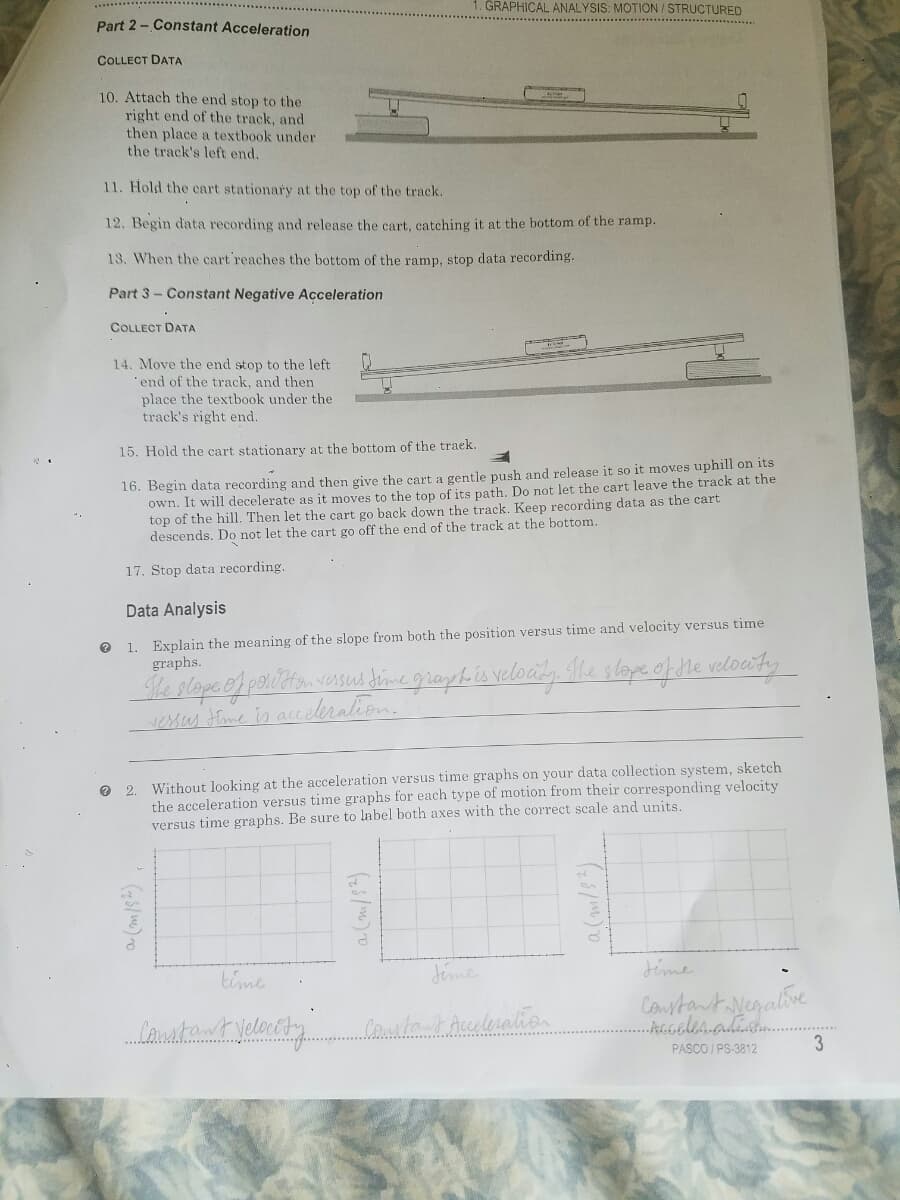
Part 2 - Constant Acceleration
COLLECT DATA
10. Attach the end stop to the
right end of the track, and
then place a textbook under
the track's left end.
11. Hold the cart stationary at the top of the track.
12. Begin data recording and release the cart, catching it at the bottom of the ramp.
13. When the cart reaches the bottom of the ramp, stop data recording.
Part 3- Constant Negative Acceleration
COLLECT DATA
14. Move the end stop to the left
end of the track, and then
place the textbook under the
track's right end.
15. Hold the cart stationary at the bottom of the traek.
16. Begin data recording and then give the cart a gentle push and release it so it moves uphill on its
own. It will decelerate as it moves to the top of its path. Do not let the cart leave the track at the
top of the hill. Then let the cart go back down the track. Keep recording data as the cart
descends. Do not let the cart go off the end of the track at the bottom.
17. Stop data recording.
Data Analysis
O 1. Explain the meaning of the slope from both the position versus time and velocity versus time
graphs.
Hhe slope of pontin vesus dime grapeh.cs velocity le slape of He velocity
vessus JEme is acceleration.
O 2. Without looking at the acceleration versus time graphs on your data collection system, sketch
the acceleration versus time graphs for each type of motion from their corresponding velocity
versus time graphs. Be sure to label both axes with the correct scale and units.
time
Jéme
Jime
PASCO / PS-3812
3
a (m/s").
Expert Solution
This question has been solved!
Explore an expertly crafted, step-by-step solution for a thorough understanding of key concepts.

This is a popular solution!

Trending now
This is a popular solution!

Step by step
Solved in 3 steps
