1. It is costly in both time and money to go to college. Does it pay off? According to the Conference Board Survey by the Bureau of Census, the answer is yes. The aver- age annual incomes (in thousands of dollars) of households headed by a person with the stated education level is as follows: 14.2 if grade school is the top level of edu- cation achieved, 30.1 for high school graduates, 57.4 for college graduates, and 61.0 for completion of one or more years of postgraduate studies. Make a bar graph showing household income for each education level.
1. It is costly in both time and money to go to college. Does it pay off? According to the Conference Board Survey by the Bureau of Census, the answer is yes. The aver- age annual incomes (in thousands of dollars) of households headed by a person with the stated education level is as follows: 14.2 if grade school is the top level of edu- cation achieved, 30.1 for high school graduates, 57.4 for college graduates, and 61.0 for completion of one or more years of postgraduate studies. Make a bar graph showing household income for each education level.

MATLAB: An Introduction with Applications
6th Edition
ISBN:9781119256830
Author:Amos Gilat
Publisher:Amos Gilat
Chapter1: Starting With Matlab
Section: Chapter Questions
Problem 1P

Related questions
Topic Video
Question
Transcribed Image Text:n 1.3
Graphs
33
SECTIO N 1.3 PROBLEMS
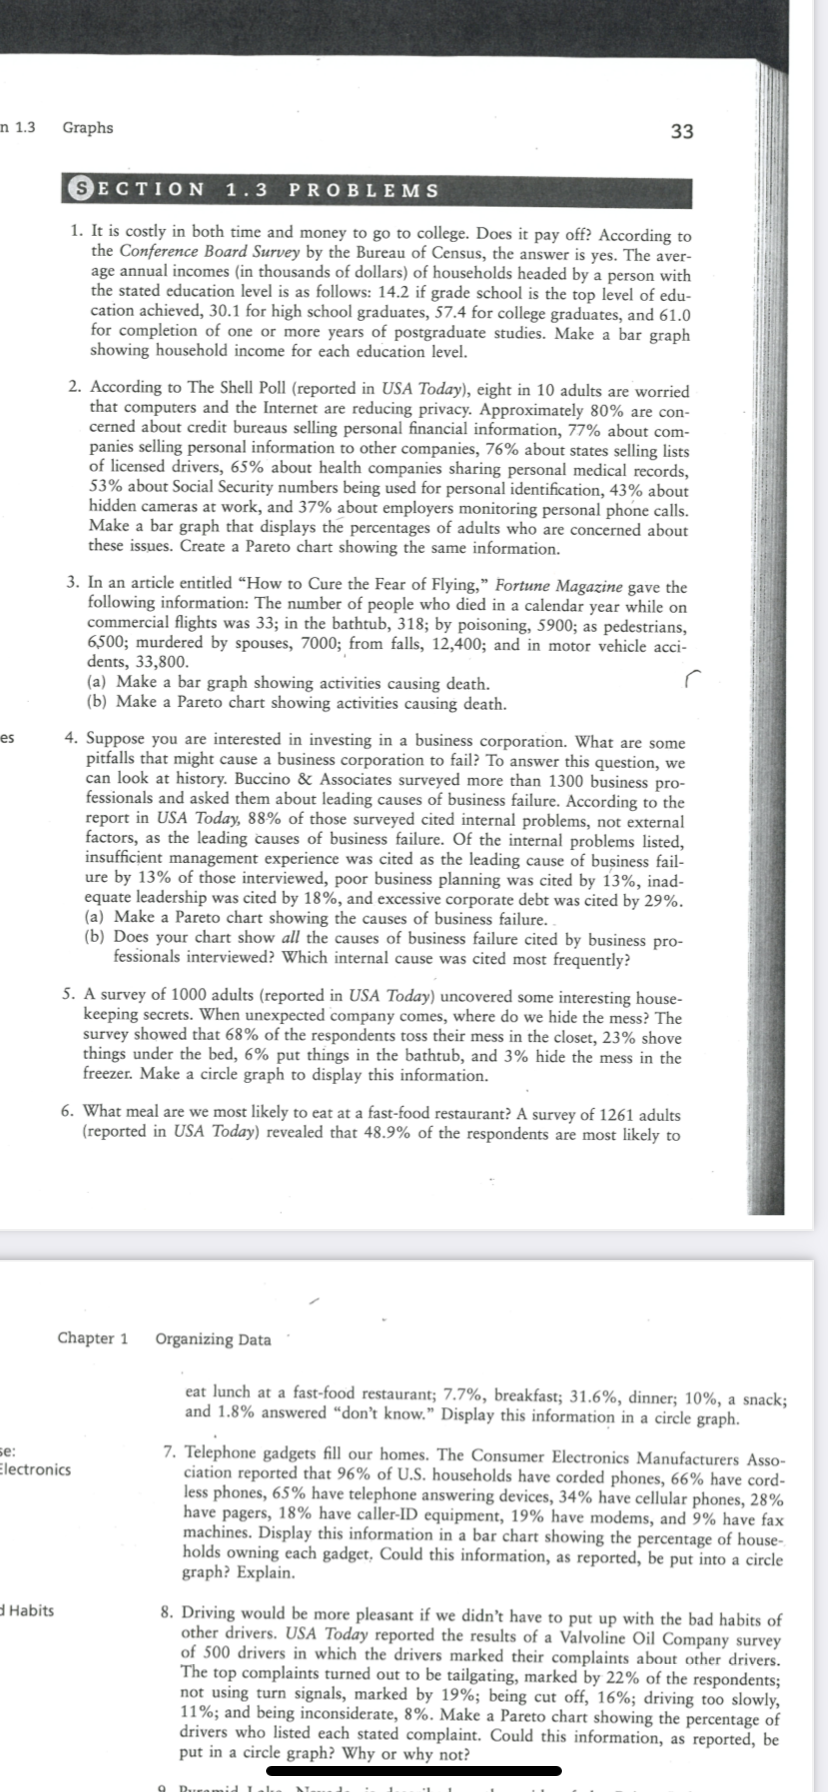
1. It is costly in both time and money to go to college. Does it pay off? According to
the Conference Board Survey by the Bureau of Census, the answer is yes. The aver-
age annual incomes (in thousands of dollars) of households headed by a person with
the stated education level is as follows: 14.2 if grade school is the top level of edu-
cation achieved, 30.1 for high school graduates, 57.4 for college graduates, and 61.0
for completion of one or more years of postgraduate studies. Make a bar graph
showing household income for each education level.
2. According to The Shell Poll (reported in USA Today), eight in 10 adults are worried
that computers and the Internet are reducing privacy. Approximately 80% are con-
cerned about credit bureaus selling personal financial information, 77% about com-
panies selling personal information to other companies, 76% about states selling lists
of licensed drivers, 65% about health companies sharing personal medical records,
53% about Social Security numbers being used for personal identification, 43% about
hidden cameras at work, and 37% about employers monitoring personal phone calls.
Make a bar graph that displays the percentages of adults who are concerned about
these issues. Create a Pareto chart showing the same information.
3. In an article entitled “How to Cure the Fear of Flying," Fortune Magazine gave the
following information: The number of people who died in a calendar year while on
commercial flights was 33; in the bathtub, 318; by poisoning, 5900; as pedestrians,
6500; murdered by spouses, 7000; from falls, 12,400; and in motor vehicle acci-
dents, 33,800.
(a) Make a bar graph showing activities causing death.
(b) Make a Pareto chart showing activities causing death.
4. Suppose you are interested in investing in a business corporation. What are some
pitfalls that might cause a business corporation to fail? To answer this question, we
can look at history. Buccino & Associates surveyed more than 1300 business pro-
fessionals and asked them about leading causes of business failure. According to the
report in USA Today, 88% of those surveyed cited internal problems, not external
factors, as the leading causes of business failure. Of the internal problems listed,
insufficient management experience was cited as the leading cause of business fail-
ure by 13% of those interviewed, poor business planning was cited by 13%, inad-
equate leadership was cited by 18%, and excessive corporate debt was cited by 29%.
(a) Make a Pareto chart showing the causes of business failure. .
(b) Does your chart show all the causes of business failure cited by business pro-
fessionals interviewed? Which internal cause was cited most frequently?
es
5. A survey of 1000 adults (reported in USA Today) uncovered some interesting house-
keeping secrets. When unexpected company comes, where do we hide the mess? The
survey showed that 68% of the respondents toss their mess in the closet, 23% shove
things under the bed, 6% put things in the bathtub, and 3% hide the mess in the
freezer. Make a circle graph to display this information.
6. What meal are we most likely to eat at a fast-food restaurant? A survey of 1261 adults
(reported in USA Today) revealed that 48.9% of the respondents are most likely to
Chapter 1
Organizing Data
eat lunch at a fast-food restaurant; 7.7%, breakfast; 31.6%, dinner; 10%, a snack;
and 1.8% answered “don't know." Display this information in a circle graph.
7. Telephone gadgets fill our homes. The Consumer Electronics Manufacturers Asso-
ciation reported that 96% of U.S. households have corded phones, 66% have cord-
less phones, 65% have telephone answering devices, 34% have cellular phones, 28%
have pagers, 18% have caller-ID equipment, 19% have modems, and 9% have fax
machines. Display this information in a bar chart showing the percentage of house-.
holds owning each gadget, Could this information, as reported, be put into a circle
graph? Explain.
se:
Electronics
d Habits
8. Driving would be more pleasant if we didn't have to put up with the bad habits of
other drivers. USA Today reported the results of a Valvoline Oil Company survey
of 500 drivers in which the drivers marked their complaints about other drivers.
The top complaints turned out to be tailgating, marked by 22% of the respondents;
not using turn signals, marked by 19%; being cut off, 16%; driving too slowly,
11%; and being inconsiderate, 8%. Make a Pareto chart showing the percentage of
drivers who listed each stated complaint. Could this information, as reported, be
put in a circle graph? Why or why not?
Expert Solution
This question has been solved!
Explore an expertly crafted, step-by-step solution for a thorough understanding of key concepts.

This is a popular solution!

Trending now
This is a popular solution!

Step by step
Solved in 2 steps with 1 images

Knowledge Booster


Learn more about
Need a deep-dive on the concept behind this application? Look no further. Learn more about this topic, statistics and related others by exploring similar questions and additional content below.Recommended textbooks for you
MATLAB: An Introduction with Applications
Statistics
ISBN:
9781119256830
Author:
Amos Gilat
Publisher:
John Wiley & Sons Inc

Probability and Statistics for Engineering and th…
Statistics
ISBN:
9781305251809
Author:
Jay L. Devore
Publisher:
Cengage Learning

Statistics for The Behavioral Sciences (MindTap C…
Statistics
ISBN:
9781305504912
Author:
Frederick J Gravetter, Larry B. Wallnau
Publisher:
Cengage Learning
MATLAB: An Introduction with Applications
Statistics
ISBN:
9781119256830
Author:
Amos Gilat
Publisher:
John Wiley & Sons Inc
Probability and Statistics for Engineering and th…
Statistics
ISBN:
9781305251809
Author:
Jay L. Devore
Publisher:
Cengage Learning
Statistics for The Behavioral Sciences (MindTap C…
Statistics
ISBN:
9781305504912
Author:
Frederick J Gravetter, Larry B. Wallnau
Publisher:
Cengage Learning

Elementary Statistics: Picturing the World (7th E…
Statistics
ISBN:
9780134683416
Author:
Ron Larson, Betsy Farber
Publisher:
PEARSON

The Basic Practice of Statistics
Statistics
ISBN:
9781319042578
Author:
David S. Moore, William I. Notz, Michael A. Fligner
Publisher:
W. H. Freeman

Introduction to the Practice of Statistics
Statistics
ISBN:
9781319013387
Author:
David S. Moore, George P. McCabe, Bruce A. Craig
Publisher:
W. H. Freeman