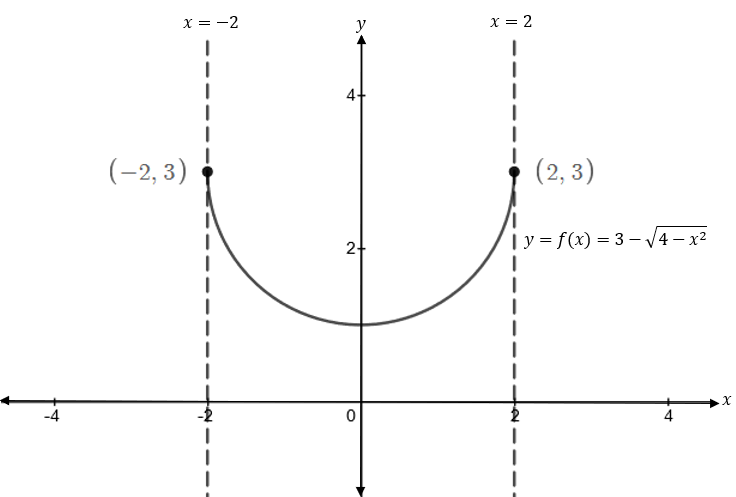
1. Sketch the graph of the function y = f(x) = 3 – V4 – x² over [-2, 2] and use this to evaluate the definite integral below by using known areas: 3 x2 dx. -


Contingency Table
A contingency table can be defined as the visual representation of the relationship between two or more categorical variables that can be evaluated and registered. It is a categorical version of the scatterplot, which is used to investigate the linear relationship between two variables. A contingency table is indeed a type of frequency distribution table that displays two variables at the same time.
Binomial Distribution
Binomial is an algebraic expression of the sum or the difference of two terms. Before knowing about binomial distribution, we must know about the binomial theorem.
#1
Thank you!
![1. Sketch the graph of the function y = f(x) = 3 – V4 – x² over [-2, 2] and use this to
evaluate the definite integral below by using known areas:
3
x2 dx.
-](/v2/_next/image?url=https%3A%2F%2Fcontent.bartleby.com%2Fqna-images%2Fquestion%2Fcc438c34-6e26-4f6a-9067-f367a43a4982%2F6989c8c4-49b0-42e4-bcc9-c9c13a220be8%2Fgpdv2.png&w=3840&q=75)
Given: The function ,
Interval:
Integral:
The graph of the function is as follows;
To evaluate integral using known area we have to break the figure into known shapes.
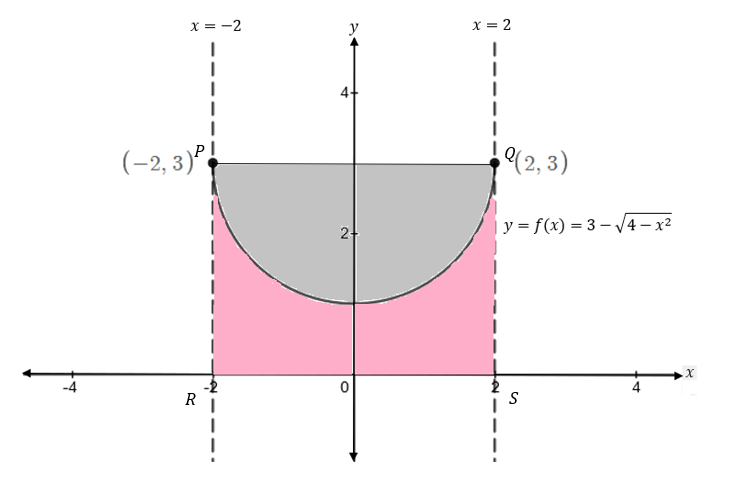
The pink part is the required area.

Step by step
Solved in 3 steps with 2 images


