MATLAB: An Introduction with Applications
6th Edition
ISBN: 9781119256830
Author: Amos Gilat
Publisher: John Wiley & Sons Inc
expand_more
expand_more
format_list_bulleted
Question

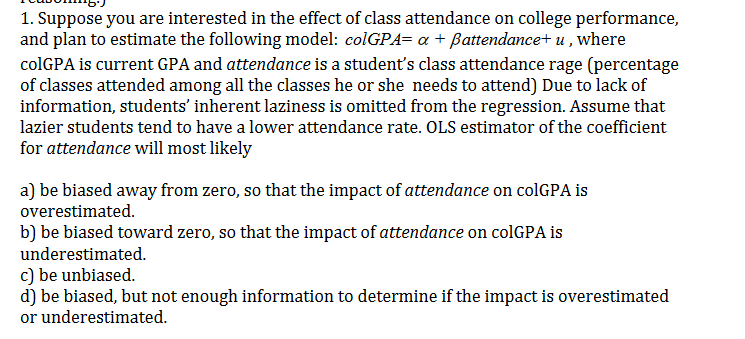
Transcribed Image Text:1. Suppose you are interested in the effect of class attendance on college performance,
and plan to estimate the following model: colGPA= a Battendance+ u,where
colGPA is current GPA and attendance is a student's class attendance rage (percentage
of classes attended among all the classes he or she needs to attend) Due to lack of
information, students' inherent laziness is omitted from the regression. Assume that
lazier students tend to have a lower attendance rate. OLS estimator of the coefficient
for attendance will most likely
a) be biased away from zero, so that the impact of attendance on colGPA is
overestimated
b) be biased toward zero, so that the impact of attendance on colGPA is
underestimated
c) be unbiased.
d) be biased, but not enough information to determine if the impact is overestimated
or underestimated
Expert Solution

This question has been solved!
Explore an expertly crafted, step-by-step solution for a thorough understanding of key concepts.
This is a popular solution
Trending nowThis is a popular solution!
Step by stepSolved in 2 steps

Knowledge Booster
Similar questions
- If the regression line is not a "good fit" what would be better to use to approximate a response variable?arrow_forwardA colleague of yours is completing a final report on the causes of the frequency of cyberbullying. In this report, she is asked to identify the causes that most strongly impacted the frequency of cyberbullying. She conducts an OLS regression. What statistic do you advise her to use in her discussion? Why?arrow_forwardData on 220 reported crimes is collected from district X in 2016. Suppose CS denotes the total cost to the state of offering crime protection services to this district (in thousand dollars), LEOP denotes the number of law enforcement officers on patrol, DTP denotes the damage to public and private property (in thousand dollars), CCTV denotes the number of CCTV cameras installed in the district, and Prison denotes the number of prison inmates The following table shows the results of a few regressions of the total cost to the state. Dependent variable: total cost to the state (in thousand dollars) Regressor (1) (2) (3) (4) 12.32 17.99 14.55 18.1 LEOP (0.52) (0.84) (2.25) (0.82) 0.73 0.59 0.75 DTP (0 12) (0.04) 0.73 (0.06) CCTV (0.13) 2.11 2.12 (0.39) 288.5 (4 14) Prison (0.5) 182.5 191.6 219.95 Intercept (11.52) (6.68) (5.26) 0.64 0.75 0.12 0.75 R 220 220 220 220 Heteroskedasticity-robust standard errors are given in parentheses under coefficients. Which of the following statements…arrow_forward
- If a scatterplot is created in excel, and a line of regression is fit along with a derived functional form, what does it mean to describe and interpret them? What conclusions would be made about relationships between two recorded variables?arrow_forwardThe table below gives the number of hours spent unsupervised each day as well as the overall grade averages for seven randomly selected middle school students. Using this data, consider the equation of the regression line, bo + b₁x, for predicting the overall grade average for a middle school student based on the number of hours spent unsupervised each day. Keep in mind, the correlation coefficient may or may not be statistically significant for the data given. Remember, In practice, it would not be appropriate to use the regression line to make a prediction if the correlation coefficient is not statistically significant. a Answer How to enter your answer (opens in new window) Step 6 of 6: Find the value of the coefficient of determination. Round your answer to three decimal places. 9 S e $ A A Hours Unsupervised Overall Grades V 96 5 t 8 b Oll 0 0.5 1 3.5 4 5 5.5 95 92 85 83 81 73 63 h → U İ 8 i k N 9 O alt I * Р ctri Tables Copy Data Keypad Keyboard Shortcuts Previous step answers…arrow_forwardZagat restaurant guides publish ratings of restaurants for many large cities around the world. The restaurants are rated on a 0 to 30 point scale based on quality of food, decor, service, and cost. Suppose that someone wants to predict the cost of dinner at a restaurant in a city based on the Zagat food quality ratings. If 10 restaurants in a city are sampled and the regression output is given below, what can we conclude about the slope of food quality? Since we are not given the dataset, we do not have enough information to determine if the slope differs from 0. 2) The slope is 2.521 and therefore differs from 0. 3) The slope significantly differs from 0. 4) Not enough evidence was found to conclude the slope differs significantly from 0. 5) The slope is equal to 0.arrow_forward
- A rural state wants to encourage high school graduates to continue their education and attend college. The state collected information on a random sample of high school seniors from across the state 7 years ago and is now observing how many years of education they completed. They believe students decide to achieve more education when they are more capable, have easier access to college education, and the opportunity cost of attending are lower. To explore the factors that affect the years of education completed they have used multiple regression to estimate the years of completed education as a function of: Unemployment rate - the unemployment rate in the county (3.9 – 16.8) County Hr Wage - average starting hourly manufacturing wage in the county Test - student score on college admission test (0 to 100 scale) Dist to college - Distance to near college (measured in 100’s of miles) Tuition - Tuition charged at nearest state university (measured in $1000s)…arrow_forwardYou plan to fit a regression model that will be used to predict first-year college GPA (FYGPA) from high-school GPA (HSGPA), ACT score (ACT), first-generation status (Yes or No), socioeconomic class (lower class, lower to middle class, middle to upper class, and upper class), and school type (public or private). What is the total number of estimated regression coefficients? If the sample size is n = 250 students, what are the degrees of freedom for the following sources of variation: Regression Error Totalarrow_forwardLet's study the relationship between brand, camera resolution, and internal storage capacity on the price of smartphones. Use α = .05 to perform a regression analysis of the Smartphones01CS dataset, and then answer the following questions. When you copy and paste output from MegaStat to answer a question, remember to choose to "Keep Formatting" to paste the text. a. Did you find any evidence of multicollinearity and variance inflation among the predictors. Explain your answer using a VIF analysis. b. Copy and paste the normal probability plot for your analysis. Is there any evidence that the errors are not normally distributed? Explain. c. Copy and paste the Residuals vs. Predicted Y-values. Does the pattern support the null hypothesis of constant variance for the errors? Explain. d. Study the residuals analysis. Which observations, if any, have unusual residuals? e. Study the residuals analysis. Calculate the leverage statistic. Which observations, if any, are high leverage…arrow_forward
arrow_back_ios
arrow_forward_ios
Recommended textbooks for you
- MATLAB: An Introduction with ApplicationsStatisticsISBN:9781119256830Author:Amos GilatPublisher:John Wiley & Sons IncProbability and Statistics for Engineering and th...StatisticsISBN:9781305251809Author:Jay L. DevorePublisher:Cengage LearningStatistics for The Behavioral Sciences (MindTap C...StatisticsISBN:9781305504912Author:Frederick J Gravetter, Larry B. WallnauPublisher:Cengage Learning
- Elementary Statistics: Picturing the World (7th E...StatisticsISBN:9780134683416Author:Ron Larson, Betsy FarberPublisher:PEARSONThe Basic Practice of StatisticsStatisticsISBN:9781319042578Author:David S. Moore, William I. Notz, Michael A. FlignerPublisher:W. H. FreemanIntroduction to the Practice of StatisticsStatisticsISBN:9781319013387Author:David S. Moore, George P. McCabe, Bruce A. CraigPublisher:W. H. Freeman

MATLAB: An Introduction with Applications
Statistics
ISBN:9781119256830
Author:Amos Gilat
Publisher:John Wiley & Sons Inc

Probability and Statistics for Engineering and th...
Statistics
ISBN:9781305251809
Author:Jay L. Devore
Publisher:Cengage Learning

Statistics for The Behavioral Sciences (MindTap C...
Statistics
ISBN:9781305504912
Author:Frederick J Gravetter, Larry B. Wallnau
Publisher:Cengage Learning

Elementary Statistics: Picturing the World (7th E...
Statistics
ISBN:9780134683416
Author:Ron Larson, Betsy Farber
Publisher:PEARSON

The Basic Practice of Statistics
Statistics
ISBN:9781319042578
Author:David S. Moore, William I. Notz, Michael A. Fligner
Publisher:W. H. Freeman

Introduction to the Practice of Statistics
Statistics
ISBN:9781319013387
Author:David S. Moore, George P. McCabe, Bruce A. Craig
Publisher:W. H. Freeman