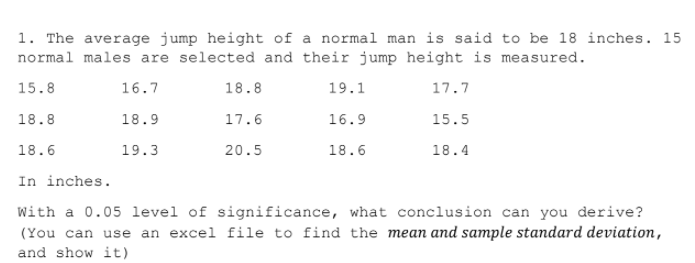
1. The average jump height of a normal man is said to be 18 inches. 1 normal males are selected and their jump height is measured. 15.8 16.7 18.8 19.1 17.7 18.8 18.9 17.6 16.9 15.5 18.6 19.3 20.5 18.6 18.4 In inches. With a 0.05 level of significance, what conclusion can you derive? (You can use an excel file to find the mean and sample standard deviation, and show it)


Q: 7.2.16 The following are intraocular pressure (mm Hg) values recorded for a sample of 21 elderly…
A:
Q: A researcher obtains M = 34 with SS = 190 for a sample of n = 10 girls and M = 29 with SS = 170 for…
A:
Q: Ackerman and Goldsmith (2011) found that students who studied text from printed hardcopy had better…
A: From provided information, claim is score for students using e-books were significantly different…
Q: A sample of 10 test coupons from two companies, reveals the titanium content in an aircraft- grade…
A:
Q: Ackerman and Goldsmith (2011) found that students who studied text from printed hardcopy had better…
A: Given values, Calculate the sample standard deviation.
Q: Weinstein, McDermott, and Roediger (2010) report that students who were given questions to be…
A:
Q: Prior to taking an aerobic lesson, each of the 12 health-club members is asked to rate the…
A:
Q: Question No: 01 Aalia 45 Y Ranbir 61 M Deepika 52 F Y Shalini 56 Y Akshay 60 M N a. Identify the…
A: “Since you have posted a question with multiple sub-parts, we will solve first three subparts for…
Q: 1. J. D. Power and Associates conducts vehicle quality surveys to provide automobile man- ufacturers…
A: Since you have asked multiple questions, we will solve the first question for you. If you want any…
Q: 3. As part of the National Heath and Nutrition Examination Survey, the Department of Heath and Human…
A: For the paired t-test, the test statistic t=d¯Sn~t(n-1)where, d=difference between two variables…
Q: Following data are only a sample of number of cars rented daily: 3 2 4 2 5 4 2 6 1 Test the…
A: Given Null hypothesis : mean number of car rented is greater than 4 Alternative hypothesis: mean…
Q: In order to know whether the average yearly incomes of marketing managers in the East and West of…
A: 1) State null and alternative hypothesis Null hypothesis Ho: Difference in average yearly income…
Q: Which of the following is not a Reliability Index O a. FOR O b. LOLP O c. LOEP O d. Reserve Margin
A: Hello. Since your question has multiple parts, we will solve first question for you. If you want…
Q: The claim is that the proportion of accidental deaths of the elderly attribute to residential falls…
A: From the provided information: The hypotheses can be constructed as: Null hypothesis: H0: p = 0.15…
Q: In order to determine whether the significant difference in the durability of 3makes of computers,…
A: For the given data, ANOVA will be used: Given data set: A B C 5 8 7 6 10 3 8 11 5 9 12 4…
Q: What conclusion can be drawn from the following given? Ho: µ= 30.5 Ha: u< 30.5 o=3.4 x=28.6 n = 42…
A:
Q: As noted on page 275, when the two population means are equal, the estimated standard error for the…
A: 1. Let the null hypothesis be H0: μ1=μ2. Let the sum of squares of the first sample be SS1=70. Let…
Q: Given are the scores of 10 employees from their 20-point assessment 16 18 10 8 12 15 19 17 16 7…
A: Given are the scores of 10 employees from their 20-point assessment Scores are :…
Q: A sociologist was interested in estimating some aspects of family life in a town. Information about…
A: The elements of the population is the number of families in town. The population size is,
Q: To test whether the mean time needed to mix a batch of material is the same for machines produced by…
A: Manufacture: 1 2 3 20 28 21 25 27 20 25 30 22 26 31 25…
Q: 1 The personnel department of BBS is concerned about absenteeism ar a general feeling that the…
A: The mean number of absentees are given for each quarters for the year 2011-2014.
Q: Given are the scores of 10 employees from their 20-point assessment 16 18 10 8 12 15 19 17 16 7…
A: Arrange the given data in ascending order7, 8, 10, 12, 15, 16, 16, 17, 18, 19sample size(n)=10
Q: For an acceptable quality level (AQL) of 1%, a lot tolerance proportion defective (LTPD) of 4% and a…
A: Given:-
Q: Identify each of the following as either descriptive or inferential statistics. a. The average…
A: As per the company policy i can answer only first question for you,more than that leads me towards…
Q: dentify each of the following as either descriptive or inferential statistics. a. The average salary…
A: Hi! Thank you for the question, As per the honor code, we are allowed to answer one question at a…
Q: For each of the following investigations, state i) null hypothesis, ii) alternative hypothesis and…
A: Given: Income from tobacco farming is greater than that of from tea farming in Malawi.
Q: The better-selling candies are often high in calories. Assume that the following data show the…
A: Given Information: The data represents the calorie content from samples of M&M's, kit Kat and…
Q: 1. Consider the following information. SSTR = 6750 H0: μ1 = μ2 = μ3 = μ4 SSE = 8000 Ha: At least…
A: The sum of squares due to error is 8000, and there are four treatments with each 5 samples.
Q: Manufacturer 1 2 3 19 29 21 26 26 19 24 32 24 27 25 16 (a) Use these data to test whether the p
A: a) By applying the ANOVA test for a single factor, The Null and alternative hypothesis: Ho: µ1 =…
Q: Ackerman and Goldsmith (2011) found that students who studied text from printed hardcopy had better…
A: Solution : Given information: a) n= 9 sample size Degrees of freedom =df=n-1=9-1=8 M=77.2 Sample…
Q: Given are the scores of 10 employees from their 20-point assessment 16 18 10 8 12 15 19 17 16 7 D3 =…
A:
Q: Assume a univariate quantitative data set, which contains fifty observations, has been organized by…
A: We have to answer question related to frequency distribution table.
Q: Ackerman and Goldsmith (2011) found that students who studied text from printed hardcopy had better…
A: State the hypotheses That is, there is no evidence to conclude that scores for students using…
Q: Ackerman and Goldsmith (2011) found that students who studied text from printed hardcopy had better…
A: We have to test the claim that scores for students using e-books were sufficiently different from…
Q: here are the 25 data set 4;4;5;5;5;6;6;6;6;7;7;7;7;8;8;8;9;9;9;10;10;10;11; 12;12 mean : 7.64 sd:…
A: Note that : The Empirical Rule does not apply to all data sets, only to those that are bell-shaped,…
Q: The table below summarizes data from a survey of a sample of women. Using a 0.05 significance level,…
A: Here it is needed to test, whether the proportions of agree/disagree responses are the same for…
Q: Ackerman and Goldsmith (2011) found that students who studied text from printed hardcopy had better…
A: Given Information : Ackerman and Goldsmith (2011) found that students who studied text from printed…
Q: 1. Below are the records used in a study to provide sufficient evidence whether the two population…
A:
Q: Suppose a study reported that the average persin watched 3.37 hours of television per day. a random…
A:
Q: An entomologist believes that the median body length of lady beetles is 15.0 millimeters. A random…
A: From the data: x¯=15.1125s=0.3117 Null and Alternate Hypothesis: H0: μ=15Ha: μ≠15
Q: Ackerman and Goldsmith (2011) found that students who studied text from printed hardcopy had better…
A:
Q: Consider the following difference-in-differences estimator for the effect of a new garbage…
A: GivenThe coefficient on nearinc is -11863.90. This represents that for every unit increase in y81*…
Q: 9. The maximum acceptable level of a certain toxic chemical in vegetables has been set at 0.4 parts…
A:
Q: 31. Calculate Coefficient of Concurrent Deviation from the following data: X: 1 2. 3 4. 5. Y: 25 16…
A:
Q: 10 The following table shows the frequency distribution of the number of children at a childcare…
A:
Q: 5.1.c Find the MOM estimator for o? Are the MOM estimator for o? and the MLE for o² the same?
A:
Q: Ackerman and Goldsmith (2011) found that students who studied text from printed hardcopy had better…
A:
Q: 16. Which of the following is the best summary of the results? AX. College seniors exhibited higher…
A: Given : Here the Data variable which is being measured is "Stress Levels" and we know the Dependent…
Q: Consider the following information. SSTR = 6750 H0: μ1 = μ2 = μ3 = μ4 SSE = 8000 Ha: At least one…
A: Given, SSTR=6750 SSE=8000 k=4α=0.05 The hypothesis to be tested here is: H0:μ1=μ2=μ3=μ4H1:At least…
Q: 23. Calculate the coefficient of concurrent deviation from the following: 60 55 50 56 30 70 40 35 80…
A:

Step by step
Solved in 2 steps


- The average jump height of a normal man is said to be 18 inches. 15 normal males are selected and their jump height is measured.15.8 16.7 18.8 19.1 17.718.8 18.9 17.6 16.9 15.518.6 19.3 20.5 18.6 18.4In inches.With a 0.05 level of significance, what conclusion can you derive?The table below summarizes data from a survey of a sample of women. Using a 0.01significance level, and assuming that the sample sizes of 800 men and 300 women are predetermined, test the claim that the proportions of agree/disagree responses are the same for subjects interviewed by men and the subjects interviewed by women. Does it appear that the gender of the interviewer affected the responses of women? Gender of Interviewer Man Woman Women who agree 498 247 Women who disagree 302 53 Compute the test statistic, rounding to three decimal places. Find the critical value(s). (Round to three decimal places) What is the conclusion based on the hypothesis test?A marketing research group found that 25% of the 200 shoppers, it recently interviewed at a certain shopping center, resided more than 12 miles from the center. Assume that a random sample was taken, construct a 95% C.I. for the actual; percentage of shoppers who live more than 15 miles from that center.
- The number of contaminating particles on a silicon waferprior to a certain rinsing process was determined for eachwafer in a sample of size 100, resulting in the followingfrequencies:Number of particles 0 1 2 3 4 5 6 7Frequency 1 2 3 12 11 15 18 10Number of particles 8 9 10 11 12 13 14Frequency 12 4 5 3 1 2 1a. What proportion of the sampled wafers had at leastone particle? At least five particles?b. What proportion of the sampled wafers had betweenfive and ten particles, inclusive? Strictly between fiveand ten particles?c. Draw a histogram using relative frequency on thevertical axis. How would you describe the shape of thehistogram?A company specializes in producing bunkers located in places with extremely cold climates under 0°C. A prototype for a new bunker design using different structure design and materials was tested to have the following average interior temperatures: 23.01, 22.22, 22.04, 22.62, and 22.59. Test that the average interior temperature is equal to 22.5 °C using α = 0.05. a.What are the hypothesis statements?Nine laboratory equipment dealers were asked for price quotes on two similar air quality samplers. The results of the survey are given below. At α = 0.05, is it reasonable to assert that on an average, sampler manufactured by company A is less expensive than sampler manufactured by company B?Dealer 1 2 3 4 5 6 7 8 9Company A price (in $) 250 319 285 260 305 295 289 309 275Company B price (in $) 270 325 269 275 289 285 295 325 300
- A research center claims that 26% of adults in a certain country would travel into space on a commercial flight if they could afford it. In a random sample of 1000 adults in that country, 29% say that they would travel into space on a commercial flight if they could afford it. At α=0.05, is there enough evidence to reject the research center's claim? Complete parts (a) through (d) below. (a) Identify the claim and state H0 and Ha. "Recall that the claim is the percentage of adults in the country would travel into space on a commercial flight if they could afford it. Let a success be an adult in the country who would travel into space on a commercial flight if they could afford it. Translate the claim made about the population parameter from a verbal statement to a mathematical statement." (b) Use technology to find the P-value. (c) Decide whether to reject or fail to reject the null hypothesis and (d) interpret the decision in the context of the original claim.The average 1-year-old is 29 inches tall. A random sample of 30 one-year-olds in a large day carefranchise resulted in the following heights. At a = 0.05, can it be concluded that the averageheight differs from 29 inches? Assume o = 2.61 2532 35 25 30 26.5 26 25.5 29.5 32 28.5 30 32 28 31.5 30 27 28 33 28 29 32 29 27 29.5 32 30 29 34 29.5A union leader claims that absences on the different days of the week are equally likely. To test this claim, a company manager collects the data shown below. Use a 0.05 significance level to test the claim. Day Mon Tue Wed Thur Fri Absences 40 15 12 23 43 a. Before doing any calculations, do the data appear to support the union leader's claim? Why or why not? A. No, absences on The and Wed are much larger than on other days B. Yes, there are roughly the same number of absences on the different days of the week C. Yes, more absences on Mon and Fri are normal D. No, absences on Mon and Fri are much larger than on other days b. State Upper H 0 . A. At least one proportion is different than claimed B. p Subscript Mon Baseline equals 1 divided by 4 comma p Subscript Tue Baseline equals 1 divided by 4 comma p…
- You are given the following hypotheses H 0 :p=0.3 H A :p not equal 0.3 We know that the sample size 90. For what sample proportion would the pvalue be equal to 0.1? Assume that all conditions necessary for Inference are satisfied.in a city a,20% of a random sample of a 900 school boys had a slight certain physical defect. in another city b,18.5% of a random sample of 1600 school boys had the same defect.is the difference between the proportions is significant?A research center claims that that 31% of adults in a certain country would travel into space on a commercial flight if they could afford it. In a random sample of 1200 adults in that country, 33% say that would travel into space on a commercial flight if they could afford it. At alpa= 0.05, isthere enough evidence to reject the research centers claim complete parts a through d below