1. The average jump height of a normal man is said to be 18 inches. 15 normal males are selected and their jump height is measured. 15.8 16.7 18.8 19.1 17.7 18.8 18.9 17.6 16.9 15.5 18.6 19.3 20.5 18.6 18.4 In inches. With a 0.05 level of significance, what conclusion can you derive? (You can use an excel file to find the mean and sample standard deviation, and show it)
1. The average jump height of a normal man is said to be 18 inches. 15 normal males are selected and their jump height is measured. 15.8 16.7 18.8 19.1 17.7 18.8 18.9 17.6 16.9 15.5 18.6 19.3 20.5 18.6 18.4 In inches. With a 0.05 level of significance, what conclusion can you derive? (You can use an excel file to find the mean and sample standard deviation, and show it)

Glencoe Algebra 1, Student Edition, 9780079039897, 0079039898, 2018
18th Edition
ISBN:9780079039897
Author:Carter
Publisher:Carter
Chapter10: Statistics
Section10.6: Summarizing Categorical Data
Problem 34PPS

Related questions

Question
PLEASE ANSWER USING THESE 7 STEPS:
-PARAMETER OF THE INTEREST
-NULL HYPOTHESIS
-ALTERNATIVE HYPOTHESIS
-TEST STATISTICS
-REJECT Ho IF
-COMPUTATIONS
-CONCLUSION
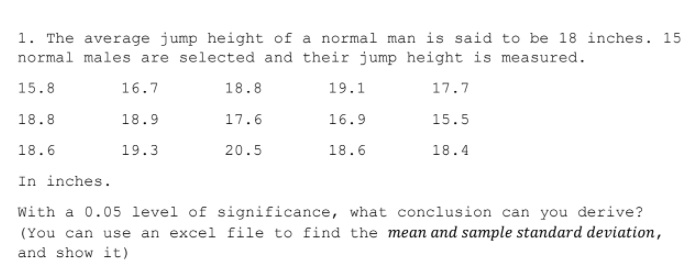
Transcribed Image Text:1. The average jump height of a normal man is said to be 18 inches. 15
normal males are selected and their jump height is measured.
15.8
16.7
18.8
19.1
17.7
18.8
18.9
17.6
16.9
15.5
18.6
19.3
20.5
18.6
18.4
In inches.
With a 0.05 1level of significance, what conclusion can you derive?
(You can use an excel file to find the mean and sample standard deviation,
and show it)
Expert Solution
This question has been solved!
Explore an expertly crafted, step-by-step solution for a thorough understanding of key concepts.

Step by step
Solved in 2 steps with 3 images

Knowledge Booster


Learn more about
Need a deep-dive on the concept behind this application? Look no further. Learn more about this topic, statistics and related others by exploring similar questions and additional content below.Recommended textbooks for you
Glencoe Algebra 1, Student Edition, 9780079039897…
Algebra
ISBN:
9780079039897
Author:
Carter
Publisher:
McGraw Hill
Glencoe Algebra 1, Student Edition, 9780079039897…
Algebra
ISBN:
9780079039897
Author:
Carter
Publisher:
McGraw Hill