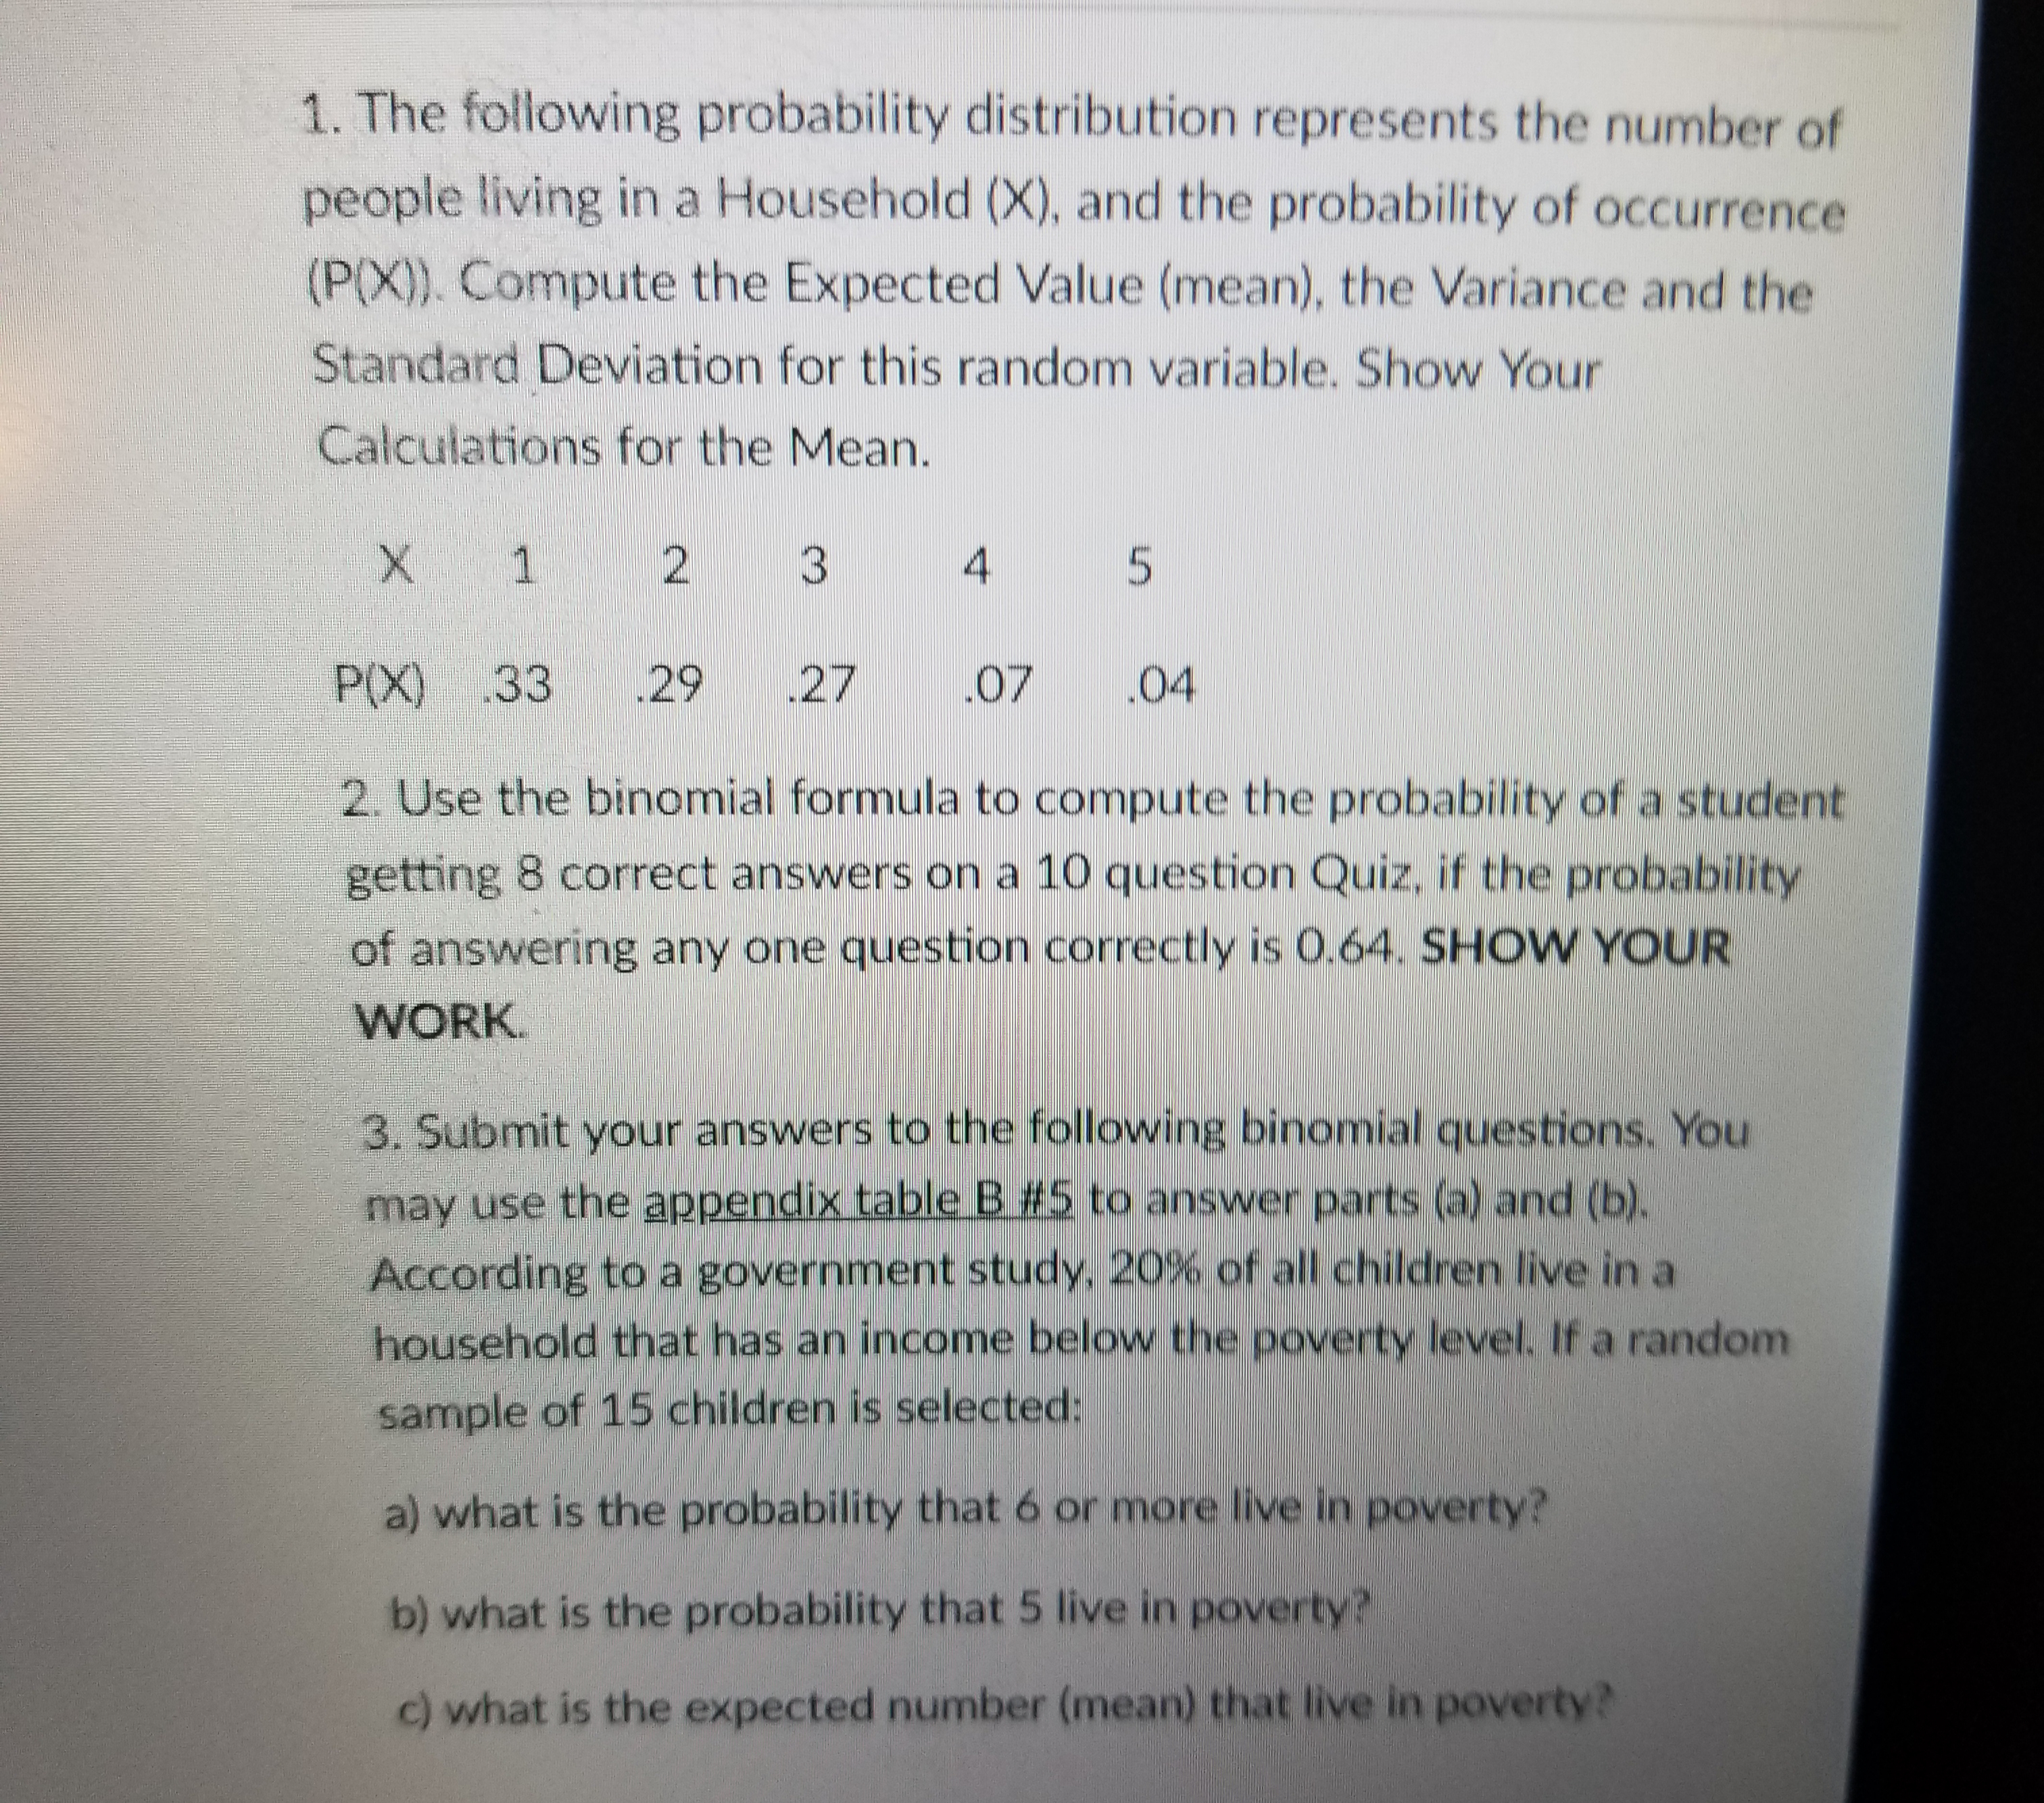
1. The following probability distribution represents the number of people living in a Household (X), and the probability of occurrence (P(X). Compute the Expected Value (mean), the Variance and the Standard Deviation for this random variable. Show Your Calculations for the Mean. X 1 2 3 4 5 P(X) 33 29 27 07 .04 2. Use the binomial formula to compute the probability of a student getting 8 correct answers on a 10 question Quiz, if the probability of answering any one question correctly is 0.64. SHOW YOUR WORK 3. Submit your answers to the following binomial questions. You may use the appendix table BE2 to answer parts (a) and (b). According to a government study, 20%of all children live in a household that has an income below the poverty level. If a random sample of 15 children is selected: a) what is the probability that 6 or more live in poverty? b) what is the probability that 5 live in poverty? c) what is the expected number (mean) that live in poverty?
1. The following probability distribution represents the number of people living in a Household (X), and the probability of occurrence (P(X). Compute the Expected Value (mean), the Variance and the Standard Deviation for this random variable. Show Your Calculations for the Mean. X 1 2 3 4 5 P(X) 33 29 27 07 .04 2. Use the binomial formula to compute the probability of a student getting 8 correct answers on a 10 question Quiz, if the probability of answering any one question correctly is 0.64. SHOW YOUR WORK 3. Submit your answers to the following binomial questions. You may use the appendix table BE2 to answer parts (a) and (b). According to a government study, 20%of all children live in a household that has an income below the poverty level. If a random sample of 15 children is selected: a) what is the probability that 6 or more live in poverty? b) what is the probability that 5 live in poverty? c) what is the expected number (mean) that live in poverty?
Chapter2: Mathematics For Microeconomics
Section: Chapter Questions
Problem 2.15P
Related questions
Question
Only question #1. Little stuck.

Transcribed Image Text:1. The following probability distribution represents the number of
people living in a Household (X), and the probability of occurrence
(P(X). Compute the Expected Value (mean), the Variance and the
Standard Deviation for this random variable. Show Your
Calculations for the Mean.
X 1 2 3 4 5
P(X) 33 29 27 07 .04
2. Use the binomial formula to compute the probability of a student
getting 8 correct answers on a 10 question Quiz, if the probability
of answering any one question correctly is 0.64. SHOW YOUR
WORK
3. Submit your answers to the following binomial questions. You
may use the appendix table BE2 to answer parts (a) and (b).
According to a government study, 20%of all children live in a
household that has an income below the poverty level. If a random
sample of 15 children is selected:
a) what is the probability that 6 or more live in poverty?
b) what is the probability that 5 live in poverty?
c) what is the expected number (mean) that live in poverty?
Expert Solution
This question has been solved!
Explore an expertly crafted, step-by-step solution for a thorough understanding of key concepts.
This is a popular solution!
Trending now
This is a popular solution!
Step by step
Solved in 8 steps with 7 images

Knowledge Booster
Learn more about
Need a deep-dive on the concept behind this application? Look no further. Learn more about this topic, economics and related others by exploring similar questions and additional content below.Recommended textbooks for you


Managerial Economics: A Problem Solving Approach
Economics
ISBN:
9781337106665
Author:
Luke M. Froeb, Brian T. McCann, Michael R. Ward, Mike Shor
Publisher:
Cengage Learning


Managerial Economics: A Problem Solving Approach
Economics
ISBN:
9781337106665
Author:
Luke M. Froeb, Brian T. McCann, Michael R. Ward, Mike Shor
Publisher:
Cengage Learning