1.4 1.2 pH AvgMercury

College Algebra (MindTap Course List)
12th Edition
ISBN:9781305652231
Author:R. David Gustafson, Jeff Hughes
Publisher:R. David Gustafson, Jeff Hughes
Chapter8: Sequences, Series, And Probability
Section8.7: Probability
Problem 62E: Is it possible that P(AB)=P(A)? Explain.

Related questions
Topic Video
Question
100%
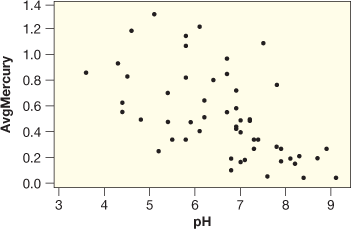
Mercury Levels in Fish
Figure 4.25 shows a scatterplot of the acidity (pH) for a sample of n = 53 Florida lakes vs the average mercury level (ppm) found in fish taken from each lake. The full dataset is introduced in Data 2.4 and is available in FloridaLakes. There appears to be a negative trend in the scatterplot, and we wish to test whether there is significant evidence of a negative association between pH and mercury levels.
Figure 4.25 Water pH vs mercury levels of fish in Florida lakes
(a)
What are the null and alternative hypotheses?
b)
For these data, a statistical software package produces the following output:
Use the p-value to give the conclusion of the test. Include an assessment of the strength of the evidence and state your result in terms of rejecting or failing to reject H0 and in terms of pH and mercury.
r=−0.575p-value=0.000017
(c)
Is this convincing evidence that low pH causes the average mercury level in fish to increase? Why or why not?
Transcribed Image Text:1.4
1.2
pH
AvgMercury
Expert Solution
This question has been solved!
Explore an expertly crafted, step-by-step solution for a thorough understanding of key concepts.

This is a popular solution!

Trending now
This is a popular solution!

Step by step
Solved in 3 steps with 1 images

Knowledge Booster


Learn more about
Need a deep-dive on the concept behind this application? Look no further. Learn more about this topic, statistics and related others by exploring similar questions and additional content below.Recommended textbooks for you
College Algebra (MindTap Course List)
Algebra
ISBN:
9781305652231
Author:
R. David Gustafson, Jeff Hughes
Publisher:
Cengage Learning
College Algebra (MindTap Course List)
Algebra
ISBN:
9781305652231
Author:
R. David Gustafson, Jeff Hughes
Publisher:
Cengage Learning