10. The director of admissions in a small college administered a newly designed entrance te 100 students selected at random from the upcoming freshman class. The purpose of this stu was to determine whether students' grade point average (GPA) at the end of the freshman ye can be predicted from the entrance test score. At the end of the year when all the data are available, what would be the graph you would use to display the data? A. A histogram of the entrance test scores. B. A histogram of the GPAS. C. A scatterplot with GPA on the y-axis and the entrance test scores on the x-axis. D. A scatter plot with the entrance test scores on the y-axis and GPA on the x-axis.
10. The director of admissions in a small college administered a newly designed entrance te 100 students selected at random from the upcoming freshman class. The purpose of this stu was to determine whether students' grade point average (GPA) at the end of the freshman ye can be predicted from the entrance test score. At the end of the year when all the data are available, what would be the graph you would use to display the data? A. A histogram of the entrance test scores. B. A histogram of the GPAS. C. A scatterplot with GPA on the y-axis and the entrance test scores on the x-axis. D. A scatter plot with the entrance test scores on the y-axis and GPA on the x-axis.

Linear Algebra: A Modern Introduction
4th Edition
ISBN:9781285463247
Author:David Poole
Publisher:David Poole
Chapter4: Eigenvalues And Eigenvectors
Section4.6: Applications And The Perron-frobenius Theorem
Problem 25EQ

Related questions

Question
Transcribed Image Text:+
+
12
15
18
21
Infant Mortality Rate per 1000 Births
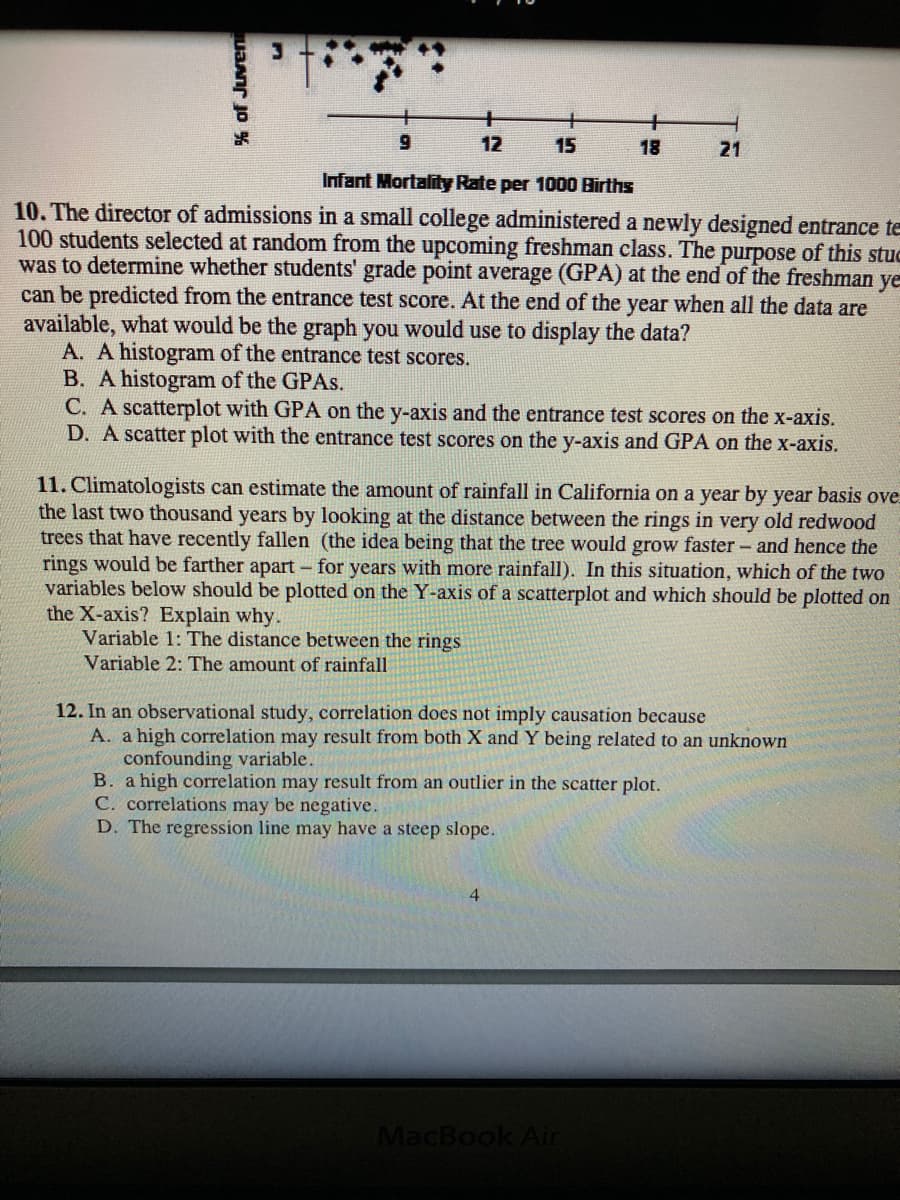
10. The director of admissions in a small college administered a newly designed entrance te
100 students selected at random from the upcoming freshman class. The purpose of this stuc
was to determine whether students' grade point average (GPA) at the end of the freshman ye
can be predicted from the entrance test score. At the end of the year when all the data are
available, what would be the graph you would use to display the data?
A. A histogram of the entrance test scores.
B. A histogram of the GPAS.
C. A scatterplot with GPA on the y-axis and the entrance test scores on the x-axis.
D. A scatter plot with the entrance test scores on the y-axis and GPA on the x-axis.
11. Climatologists can estimate the amount of rainfall in California on a year by year basis ove
the last two thousand years by looking at the distance between the rings in very old redwood
trees that have recently fallen (the idea being that the tree would grow faster - and hence the
rings would be farther apart – for years with more rainfall). In this situation, which of the two
variables below should be plotted on the Y-axis of a scatterplot and which should be plotted on
the X-axis? Explain why.
Variable 1: The distance between the rings
Variable 2: The amount of rainfall
12. In an observational study, correlation does not imply causation because
A. a high correlation may result from both X and Y being related to an unknown
confounding variable.
B. a high correlation may result from an outlier in the scatter plot.
C. correlations may be negative.
D. The regression line may have a steep slope.
4
MacBook Air
% of Juveni
Expert Solution
This question has been solved!
Explore an expertly crafted, step-by-step solution for a thorough understanding of key concepts.

This is a popular solution!

Trending now
This is a popular solution!

Step by step
Solved in 2 steps

Knowledge Booster


Learn more about
Need a deep-dive on the concept behind this application? Look no further. Learn more about this topic, statistics and related others by exploring similar questions and additional content below.Recommended textbooks for you
Linear Algebra: A Modern Introduction
Algebra
ISBN:
9781285463247
Author:
David Poole
Publisher:
Cengage Learning

Holt Mcdougal Larson Pre-algebra: Student Edition…
Algebra
ISBN:
9780547587776
Author:
HOLT MCDOUGAL
Publisher:
HOLT MCDOUGAL

College Algebra
Algebra
ISBN:
9781305115545
Author:
James Stewart, Lothar Redlin, Saleem Watson
Publisher:
Cengage Learning
Linear Algebra: A Modern Introduction
Algebra
ISBN:
9781285463247
Author:
David Poole
Publisher:
Cengage Learning
Holt Mcdougal Larson Pre-algebra: Student Edition…
Algebra
ISBN:
9780547587776
Author:
HOLT MCDOUGAL
Publisher:
HOLT MCDOUGAL
College Algebra
Algebra
ISBN:
9781305115545
Author:
James Stewart, Lothar Redlin, Saleem Watson
Publisher:
Cengage Learning

Big Ideas Math A Bridge To Success Algebra 1: Stu…
Algebra
ISBN:
9781680331141
Author:
HOUGHTON MIFFLIN HARCOURT
Publisher:
Houghton Mifflin Harcourt

Glencoe Algebra 1, Student Edition, 9780079039897…
Algebra
ISBN:
9780079039897
Author:
Carter
Publisher:
McGraw Hill

Algebra & Trigonometry with Analytic Geometry
Algebra
ISBN:
9781133382119
Author:
Swokowski
Publisher:
Cengage