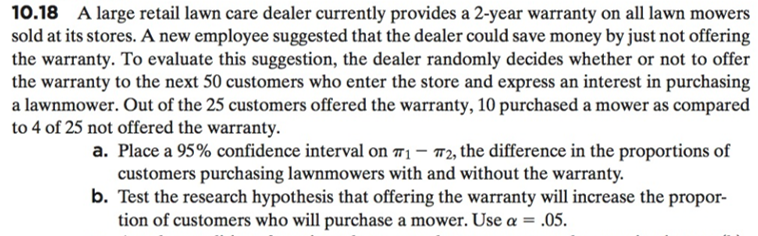
10.18 A large retail lawn care dealer currently provides a 2-year warranty on all lawn mowers sold at its stores. A new employee suggested that the dealer could save money by just not offering the warranty. To evaluate this suggestion, the dealer randomly decides whether or not to offer the warranty to the next 50 customers who enter the store and express an interest in purchasing a lawnmower. Out of the 25 customers offered the warranty, 10 purchased a mower as compared to 4 of 25 not offered the warranty. a. Place a 95% confidence interval on π,-T2, the difference in the proportions of customers purchasing lawnmowers with and without the warranty. b. Test the research hypothesis that offering the warranty will increase the propor- tion of customers who will purchase a mower. Use α-,05.
Q: A team of researchers (Singer et al., 2000) used the Survey of Consumer Attitudes to investigate…
A: Solution
Q: A doctor claims that less than 30% of all persons exposed to a certain amount of radiation will feel…
A:
Q: In 2010, 36% of adults in a certain country were morbidly obese. A health practitioner suspects that…
A: State the hypotheses. That is, there is no evidence that true percent adults in a certain country…
Q: A company manufactures cell phone chargers. In August, a random sample of 200 chargers were…
A: Let X be the number of defectives from the binomial distribution with probability (p) = 3/200 and…
Q: At LLD Records, some of the market research of college students is done during promotions on college…
A: Given, By applying ANOVA for single factor,
Q: 2 A college surveyed 1125 freshman students about which meals they ate in the school cafeteria. The…
A: Given number of freshman students who Ate only breakfast=25 Ate only lunch =15 Ate only diner = 50…
Q: Suppose that in a study of 35 million HPV shots examined, the shots were followed in time by 14,000…
A: 1. For the vaccinated group: Number of vaccinated individuals studied = 35 million = 35,000,000.…
Q: NIMBY. In March 2007, the Gallup Poll split a sampleof 1003 randomly selected U.S. adults into two…
A: a) Before offering the contract the agency will conduct a poll to investigate the athletes name for…
Q: 2. A sample of the employees of a large corporation regarding a new pension plan revealed the…
A: Null hypothesis: H0: age is independent of opinion. Alternative hypothesis: H1: Age is not…
Q: A study conducted in a certain period of time found that fewer than half of employers who hired new…
A: a) Calculations for expected frequency and chi-square tets statistic is given below:
Q: The Coca-Cola Company introduced New Coke in 1985. Within three months of this introduction,…
A: Since you have posted a question with multiple subparts, we will solve first three subparts for you.…
Q: To test the fairness of law enforcement in its area, a local citizens' group wants to know whether…
A:
Q: A random sample of n1 = 10 regions in New England gave the following violent crime rates (per…
A: Let μ1 denote mean violent crime rate in New England and μ2 denote the mean violent crime rate in…
Q: According to a recent marketing campaign, 100 drinkers of either Diet Coke or Diet Pepsi…
A: Given: x=50n=100
Q: At α = .05, test to determine if the type of car purchased is independent of the city in which the…
A: To test whether two variables are independent of each other, we need to perform a Chi square test of…
Q: randomly selected sample of 400 students at a university with 15-week semesters was asked whether…
A: Given that Sample size n =400 Sample proportion p^=46%=0.46
Q: A company that manufactures televisions of three different sizes. know that this The company has its…
A: Introduction - Chi square test χ2=∑(Oi-Ei)2Eiwhere ,Oi=observed frequency Ei=Expected…
Q: (a) In a random sample of 500 men from a particular district of UP, 300 are found to be smokers. In…
A: In the first district, Sample size=500Smokers=300 The percentage of smokers is calculated as, P1=No.…
Q: In the 2008 GSS, those who said they were raised as religious fundamentalists had a mean educational…
A: There are two independent samples which are fundamentalists and non fundamentalists. We have to test…
Q: Suppose it is claimed that 40% of adults support the practice of changing clocks twice a year in…
A:
Q: Calculate the value of the test statistic and p-value. (Round "test statistic" value to 2 decimal…
A: Analysis of variance
Q: The Coca-Cola Company introduced New Coke in 1985. Within three months of this introduction,…
A: As per guidelines we will solve the first question only, please repost other questions for more…
Q: Is it reasonable to zeneralize the study beyond the 24 participants? Explain why or why not.
A:
Q: According to a recent marketing campaign, 90 drinkers of either Diet Coke or Diet Pepsi participated…
A:
Q: In a survey of 1000 adult Americans, 46.7% indicated that they were somewhat interested or very…
A: From the provided information, Sample size (n) = 1000 Sample proportion (p̂) = 0.467 The hypotheses…
Q: in a school , 202 out of the 5900 children had developed lung disease.it was also found that…
A: Total number of children are 5900. The number of children have lung disease is 202. The number of…
Q: An organization published an article stating that in any one-year period, approximately 11.5 percent…
A:
Q: The US National Survey on Drug Use and Health reports that 4.8% of persons 12 and older regu- larly…
A: p=0.048n=900x=54p⏞=xn=0.06 d) The test statistics is…
Q: Suppose a sample of 950 men found that 642 of them favored the death penalty for capital murder…
A: we have given that A sample of 950 men found that 642 and A sample of 810 women found that 405 .…
Q: 2. A television CEO believes viewership of the evening news does not depend on age. She collects a…
A: A chi-square test of independence is used to test whether two categorical variables are associated…
Q: Suppose a sample of 950 men found that 642 of them favored the death penalty for capital murder…
A:
Q: According to a recent marketing campaign, 100 drinkers of either Diet Coke or Diet Pepsi…
A: Given that, x=55,n=100 The sample proportion is,
Q: A report by the Gallup Poll stated that on average a woman visits her physician 5.8 times a year. A…
A: (a). Null and alternate hypotheses: Based on reading the problem, we know that we are working with a…
Q: The US National Survey on Drug Use and Health reports that 4.8% of persons 12 and older regu- larly…
A: Note: " Since you have asked multiple sub-parts, we will solve the first three sub-parts for you. If…
Q: In a previous poll, 42% of adults with children under the age of 18 reported that their family ate…
A:
Q: At LLD Records, some of the market research of college students is done during promotions on college…
A: Given:
Q: m sample of 500 men from a particular district of UP, 300 are found to be smokers. In one of 1000…
A: Given: n1=500 n2=1000 x1=300 x2=550
Q: Based on a USA Today poll, 10% of the population believes that college is no longer a good…
A:
Q: 4. In a survey of families in which both parents work, one of the questions asked was, “Have you…
A: Solution: 4. Let p1 be the proportion of men has refused a job, promotion, or transfer and p2 be the…
Q: A random sample of n1 = 10 regions in New England gave the following violent crime rates (per…
A: Given Data and calculation is shown below
Q: The Global Business Travel Association (GBTA) reported the domestic airfare for business travel for…
A: If a data is paired, then to compare the population means of paired data, the paired t test is used.…
Q: In a survey of recent attendees at a Wedding with no Mask or Social distance during the Covid…
A: We want to find the probability by using total probability amd Bayes theorem.
Q: In a previous poll, 35% of adults with children under the age of 18 reported that their family ate…
A: The p-value in hypothesis testing is the probability of obtaining a test statistic value at least…
Q: The Global Business Travel Association (GBTA) reported the domestic airfare for business travel for…
A:
Q: A study published by Babcock and Marks (2010) showed that the average full-time U.S. college student…
A: μ = 14 σ = 4.8 M = 12.5 n = 64
Q: Based on a poll of registered voters in a large city, 120 out of a random sample of 250 women…
A: Given information: Given that, among a sample of 250 women, 120 voted for Donald Trump and among a…
Q: The Global Business Travel Association (GBTA) reported the domestic airfare for business travel for…
A:
Q: 19. Shreya conducted a study to see if name-brand flashlight batteries last longer than generic…
A: In SRS each member of the pop has an equal chance of getting selected. Matched pairs experiment is…
Q: At LLD Records, some of the market research of college students is done during promotions on college…
A: Let a treatment A be classified into k levels then, to test the equality of k levels means, we will…
Q: 7. Nielsen Media has recently begun attempting to estimate the monthly text usage for cell phone…
A: Statistical inference is a branch of statistics that analyses the data of probability distribution.…
Trending now
This is a popular solution!
Step by step
Solved in 10 steps with 7 images
- Do well-rounded people get fewer colds? A study on the Chronicle of Higher Education was conducted by scientist at Carnegie Mellon University, the University of Pittsburgh and the University of Virginia. They found that people who have only a few social outlets get more colds than those who are involved in a variety of social activities. Suppose that of the 276 healthy men and women tested, n1=96 had only a few social outlets and n2=105 were busy with six or more activities. When these people were exposed to a cold virus, the following results were observed: Construct a 99% confidence interval for the difference in the two population proportions.According to a local chamber of commerce, in 1993, 5.9% of local area residents owned more than five cars. A local car dealer claims that the percentage has increased. He randomly selects 180 local area residents and finds that 12 of them own more than five cars. Test this car dealer's claim at the level of significance of 0.05.Suppose a research study uses two independent groups with 21 individuals in each group. If a t-test analysis produces a calculated value of t of 1.68, which of the following is the correct decision?A. At the .05 level of significance, reject the null hypothesisB. At the .01 level of significance, reject the null hypothesisC. At the .05 level of significance, fail to reject the null hypothesisD. Impossible to answer without additional information
- In a previous poll, 42% of adults with children under the age of 18 reported that their family ate dinner together seven nights a week. Suppose that, in a more recent poll, of 1060 adults with children under the age of 18 reported that their family ate dinner together seven nights a week.dinner together seven nights a week. Suppose that, in a more recent poll, 423 of 1060adults with children under the age of 18 reported that their family ate dinner together seven nights a week. Is there sufficient evidence that the proportion of families with children under the age of 18 who eat dinner together seven nights a week has decreased? Use the α=0.01 significance level. (a) What are the null and alternative hypotheses? (b) H0 versus H1 (c) Find the test statistic, z0. (d) Find the P-value. Is there sufficient evidence that the proportion of families with children under the age of 18 who eat dinner together seven nights a week has decreased?2.Are babies born to mothers who use assistive reproduction technology (ART) more likely to be born prematurely than babies conceivednaturally? The data in the accompanying table are from a random sample of 19,614 births. Each birth was classified according to whether the mother used ART and whether the baby was premature. Use these data to decide if there is convincing evidence of an association between the use of ART and whether or not a baby ispremature. Use?=0.05.ConceivedUsing ARTConceivedNaturallyPremature1542,405Not Premature21218,843 Hypotheses: Method:Q:__________________S:__________________T:__________________N:__________________ Check: Calculate: Communicate Results:A study conducted in a certain period of time found that fewer than half of employers who hired new college graduates last academic year plan to definitely do so again. Suppose that the hiring intentions of the respondents were as follows: 32% selected Hire 29% selected Likely to Hire 21% selected Hire Uncertain 18% selected Do Not Hire Six month later, a random sample of 100 employers were asked about their hiring intentions and gave the following responses: 29 selected Hire 35 selected Likely to Hire 14 selected Hire Uncertain 22 selected Do Not Hire At 1% significance level, does it mean that proportions from the initial study have significantly changed? Use Goodness-of-Fit test and χ2χ2 distribution. For part (a), round your answers in the " (O−E)2E(O-E)2E" column to 3 decimal places. (a) Fill in the table below. Hiring Intention Observed Frequency OO Expected Frequency EE O−EO-E (O−E)2(O-E)2 (O−E)2E(O-E)2E Hire 29 Likely to Hire 35 Hire…
- 10.19. A random survey was conducted among voting-age citizens to determine whether there was any relationship between party affiliation and opinion regarding gun control. The information provided in Table 10.7 was obtained. For α = 0.01, is there any reason to believe that there is a dependence between opinion and party affiliation? Table 10.7 Party affiliation and opinions on gun control. In favor Against Undecided Democrats 110 64 26 Republicans 90 116 14 Independents 55 35 10A random sample of n1 = 10 regions in New England gave the following violent crime rates (per million population). x1: New England Crime Rate 3.3 3.7 4.2 3.9 3.3 4.1 1.8 4.8 2.9 3.1 Another random sample of n2 = 12 regions in the Rocky Mountain states gave the following violent crime rates (per million population). x2: Rocky Mountain Crime Rate 3.5 4.1 4.7 5.5 3.3 4.8 3.5 2.4 3.1 3.5 5.2 2.8 Assume that the crime rate distribution is approximately normal in both regions. Do the data indicate that the violent crime rate in the Rocky Mountain region is higher than in New England? Use ? = 0.01. Solve the problem using both the traditional method and the P-value method. (Test the difference ?1 − ?2. Round the test statistic and critical value to three decimal places.) test statistic critical value Find (or estimate) the P-value. A. P-value > 0.250 B. 0.125 < P-value < 0.250 C. 0.050 < P-value < 0.125 D. 0.025 < P-value <…A random sample of n1 = 10 regions in New England gave the following violent crime rates (per million population). x1: New England Crime Rate 3.3 3.7 4.0 3.9 3.3 4.1 1.8 4.8 2.9 3.1 Another random sample of n2 = 12 regions in the Rocky Mountain states gave the following violent crime rates (per million population). x2: Rocky Mountain Crime Rate 3.5 4.3 4.5 5.1 3.3 4.8 3.5 2.4 3.1 3.5 5.2 2.8 Assume that the crime rate distribution is approximately normal in both regions. (i) Use a calculator to calculate x1, s1, x2, and s2. (Round your answers to three decimal places.) x1 = s1 = x2 = s2 = (ii) Do the data indicate that the violent crime rate in the Rocky Mountain region is higher than in New England? Use α = 0.01.(a) What is the level of significance? What is the value of the sample test statistic? (Test the difference μ1 − μ2. Round your answer to three decimal places.)
- suppose that from a sample of 200,000 new york workers, 32,400 reported traveling more than an hour an day. From this information, statisticians determined that about 16.2% of the workers in the state traveled more than an hou to work every day in 2011. If there were 8,437,512 workers in the entire population, about how many traveled more than an hour to work each day?A random sample of n1 = 10 regions in New England gave the following violent crime rates (per million population). x1: New England Crime Rate 3.3 3.7 4.2 3.9 3.3 4.1 1.8 4.8 2.9 3.1 Another random sample of n2 = 12 regions in the Rocky Mountain states gave the following violent crime rates (per million population). x2: Rocky Mountain Crime Rate 3.9 4.1 4.5 5.5 3.3 4.8 3.5 2.4 3.1 3.5 5.2 2.8 Assume that the crime rate distribution is approximately normal in both regions. Do the data indicate that the violent crime rate in the Rocky Mountain region is higher than in New England? Use ? = 0.01. Solve the problem using both the traditional method and the P-value method. (Test the difference ?1 − ?2. Round the test statistic and critical value to three decimal places.) test statistic critical valueA random sample of n1 = 10 regions in New England gave the following violent crime rates (per million population). x1: New England Crime Rate 3.5 3.7 4.2 3.9 3.3 4.1 1.8 4.8 2.9 3.1 Another random sample of n2 = 12 regions in the Rocky Mountain states gave the following violent crime rates (per million population). x2: Rocky Mountain Crime Rate 3.9 4.1 4.5 5.1 3.3 4.8 3.5 2.4 3.1 3.5 5.2 2.8 Assume that the crime rate distribution is approximately normal in both regions. (a) Use a calculator to calculate x1, s1, x2, and s2. (Round your answers to four decimal places.) x1=s1=x2=s2= (b) Do the data indicate that the violent crime rate in the Rocky Mountain region is higher than in New England? Use ? = 0.01. (i) What is the level of significance? State the null and alternate hypotheses. H0: ?1 = ?2; H1: ?1 ≠ ?2H0: ?1 = ?2; H1: ?1 > ?2 H0: ?1 < ?2; H1: ?1 = ?2H0: ?1 = ?2; H1: ?1 < ?2 (ii) What sampling distribution will you use? What…