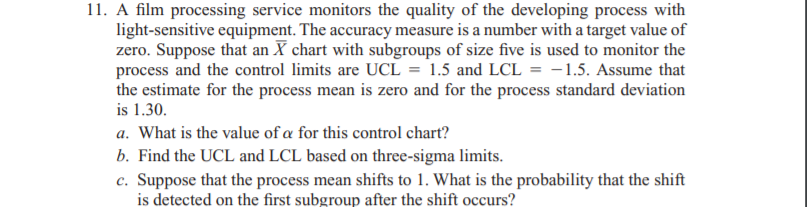
11. A film processing service monitors the quality of the developing process with light-sensitive equipment. The accuracy measure is a number with a target value of zero. Suppose that an X chart with subgroups of size five is used to monitor the process and the control limits are UCL = 1.5 and LCL = -1.5. Assume that the estimate for the process mean is zero and for the process standard deviation is 1.30. a. What is the value of a for this control chart? b. Find the UCL and LCL based on three-sigma limits. c. Suppose that the process mean shifts to 1. What is the probability that the shift is detected on the first subgroup after the shift occurs?
11. A film processing service monitors the quality of the developing process with light-sensitive equipment. The accuracy measure is a number with a target value of zero. Suppose that an X chart with subgroups of size five is used to monitor the process and the control limits are UCL = 1.5 and LCL = -1.5. Assume that the estimate for the process mean is zero and for the process standard deviation is 1.30. a. What is the value of a for this control chart? b. Find the UCL and LCL based on three-sigma limits. c. Suppose that the process mean shifts to 1. What is the probability that the shift is detected on the first subgroup after the shift occurs?

A First Course in Probability (10th Edition)
10th Edition
ISBN:9780134753119
Author:Sheldon Ross
Publisher:Sheldon Ross
Chapter1: Combinatorial Analysis
Section: Chapter Questions
Problem 1.1P: a. How many different 7-place license plates are possible if the first 2 places are for letters and...

Related questions
Question
Transcribed Image Text:11. A film processing service monitors the quality of the developing process with
light-sensitive equipment. The accuracy measure is a number with a target value of
zero. Suppose that an X chart with subgroups of size five is used to monitor the
process and the control limits are UCL = 1.5 and LCL = -1.5. Assume that
the estimate for the process mean is zero and for the process standard deviation
is 1.30.
a. What is the value of a for this control chart?
b. Find the UCL and LCL based on three-sigma limits.
c. Suppose that the process mean shifts to 1. What is the probability that the shift
is detected on the first subgroup after the shift occurs?
Expert Solution
This question has been solved!
Explore an expertly crafted, step-by-step solution for a thorough understanding of key concepts.

This is a popular solution!

Trending now
This is a popular solution!

Step by step
Solved in 7 steps with 6 images

Recommended textbooks for you
A First Course in Probability (10th Edition)
Probability
ISBN:
9780134753119
Author:
Sheldon Ross
Publisher:
PEARSON

A First Course in Probability (10th Edition)
Probability
ISBN:
9780134753119
Author:
Sheldon Ross
Publisher:
PEARSON