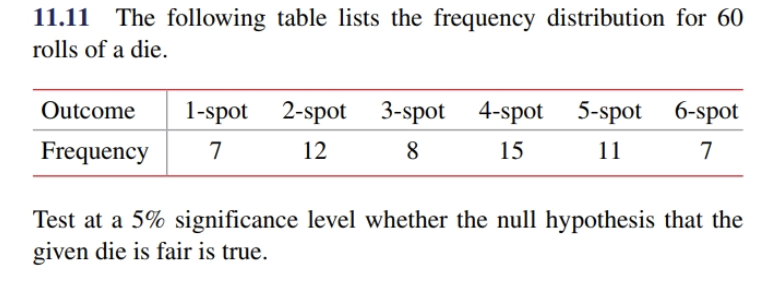
11.11 The following table lists the frequency distribution for 60 rolls of a die Outcome 1-spot 2-spot 3-spot 4-spot 5-spot 6-spot Frequency 7 12 15 7 11 Test at a 5% significance level whether the null hypothesis that the given die is fair is true.


Q: Consider the following set of samples obtained from two normally distributed populations whose…
A: Independent events are those events whose occurrence is not dependent on any other event. If the…
Q: Miller (2008) examined the energy drink consumption of college undergraduates and found that female…
A: z-test is a statistical test which can be used for testing the means of the population. This can be…
Q: 20. The following data summarize the results from an independent-measures study comparing three…
A: a)The null and alternative hypotheses are shown below:
Q: 4. A bank president claims that the median of debt-to-equity ratio of commercial loans provided is…
A: As you have posted multiple questions, We have provided answer for first question only as per our…
Q: Assume that the crime rate distribution is approximately normal in both regions. (a)Use a calculator…
A: Given : For region in new England given data :…
Q: The following data represent the level of happiness and level of health for a random sample of…
A: Given Data : Excellent Good Fair Poor Total Very Happy 271 261 82 20 634 Pretty Happy 247…
Q: Following data are only a sample of number of cars rented daily: 3 2 4 2 5 4 2 6 1 Test the…
A: Given Null hypothesis : mean number of car rented is greater than 4 Alternative hypothesis: mean…
Q: 5 The following information was obtained from two independent samples selected from two nor- nally…
A:
Q: Suppose a marketing research firm would like to examine if the social networking site that a person…
A: Hypotheses:Null hypothesis: There is no association between social networking site and the age…
Q: The following that represent the number of packages of 5 popular brands of cigarettes sold by a…
A: Given that The problem is solved using single factor ANOVA
Q: The following data were obtained from a two-factor independent-measures experiment with n = 5…
A: Given data is : B1 B2…
Q: 8. From the following data: Sample 20 15 18 12 18 14 10 20 16 1 Sample 18 12 15 10 13 15 9 18 17 2…
A: We want to test the paired t test hypothesis.
Q: 4.4 4) The quality control officer at Spaz Cola uses a systematic random sampling method to select…
A: Given Information: A systematic random sampling method was used to select cans of Spaz Cola to…
Q: 6. 8. 9. 10 11 12 13 Number of Pairs of Shoes of the distribution. number of pairs of shoes in the…
A: Distributions of data can have few or many peaks. Distributions with one clear peak are called…
Q: 11. The following sample data give the number of delivery miles each driver drove per day for the…
A: a) For vehicle A: x x-x (x-x)2 6 -5 25 14 3 9 19 8 64 11 0 0 10 -1 1 6 -5 25 11 0 0…
Q: Consider Example 11.2, and let Hp» Hsy, and µ, represent the mean monthly sales when using the…
A: Given data, Bottom Middle Top 58.2 73 52.4 53.7 78.1 49.7 55.8 75.4 50.9 55.7 76.2 54…
Q: A random sample of n1 = 10 regions in New England gave the following violent crime rates (per…
A: Given : Claim : the violent crime rate in the Rocky Mountain region is higher than in New England.
Q: 1. (18) Of 50 buildings in an industrial park, 12 have electrical code violations. If 10 buildings…
A: Given that, Number of buildings n=10 Proportion of buildings that have electrical code verification…
Q: Which of the following statement DOES NOT describe the figures below. 10 9 10 11 00 Figure (a)…
A: The hypothesis is a statement which describes the population parameter. There are two types of…
Q: The following three independent random samples are obtained from three normally distributed…
A: Excel Procedure: Enter the data for Group1, Group2 and Group3 in Excel sheet> Data>Data…
Q: Correct answer plz
A:
Q: The following three independent random samples are obtained from three normally distributed…
A: For the given data Perform Anova one way
Q: A random sample of n1 = 10 regions in New England gave the following violent crime rates (per…
A: The data shows the violent crime rates in two regions (New England, Rocky Mountain states).
Q: In a study, two groups of patients with a particular infection are given two different antibiotic…
A: There are two categorical variables which are type and time. We have to test whether there is a…
Q: 7. The following table gives the distribution of systolic blood pressure (in mm of mercury) for a…
A: Given, A random sample of 250 men aged between 30 and 39.
Q: The following data represent the number of packages of 5 popular brands of cigarettes sold by a…
A:
Q: Carry out the hypothesis test for the mean of a normally distributed population given the following…
A: Given,H0:μ≥1.6Ha:μ≠1.6sample size(n)=15mean(x¯)=1.8standard deviation(s)=25=5α=0.10
Q: The manager of a computer software company wishes to study the number of hours per week senior…
A: State the hypotheses. That is, there is no evidence to conclude that there is a difference in the…
Q: Transport engineers are interested to study the pattern Question 4 and the risk of accidents at a…
A: Mean: For a set of n observations, x1, x2, ... , xn with frequencies f1, f2, … , fn, mean is given…
Q: Consider the following two independently chosen samples whose population variances are not equal to…
A: a) Hypothesis: Null hypothesis: H0: μ1-μ2≤0Alternative hypothesis: H1: μ1-μ2>0 Step-by-step…
Q: 9. The following table gives the distribution of items of production and also the relatively…
A:
Q: The following three independent random samples are obtained from three normally distributed…
A: Given data: Group1: Internship Group2: Co-op Group3: Work study 11.5 9.25 17.5 10.75 14.5…
Q: (9. The following table gives the distribution of items of production and also h rufativety…
A: Given The following data for X and Y variables are provided to find the correlation coefficient…
Q: The following information is available for two samples selected from independent normally…
A: The value of FSTAT is given by the formula FSTAT = Larger sample variance Smaller sample…
Q: Carry out the hypothesis test for the mean of a normally distributed population given the following…
A:
Q: In a previous poll, 41% of adults with children under the age of 18 reported that their family ate…
A:
Q: A Michigan study concerning preference for outdoor activities used a questionnaire with a six-point…
A: Hello. Since your question has multiple sub-parts, we will solve first three sub-parts for you. If…
Q: The following information is available for two samples selected from independent normally…
A: Given info:
Q: , It has been hypothesised that the probability of having an asthma attack on a particular day may…
A: Note: As you have posted multiple parts, as per our policy, we have helped you with the first 3…
Q: The following that represent the number of packages of 5 popular brands of cigarettes sold by a…
A: Hello! As you have posted more than 3 sub parts, we are answering the first 3 sub-parts. In case…
Q: The following table shows age distribution and location of a random sample of 166 buffalo in a…
A: Chi square test: Chi square test is used to determine whether there is relationship between two…
Q: The following data represent a sample of people's smoking habits and their usage of seat belts while…
A:
Q: The following is the frequency distribution for the speeds of a sample of automobiles traveling on…
A: From the given information, let x be the speed of automobile travelling on an interstate highway.…
Q: Given the following data for an imaginary superhero universe: Flying Telepathy Super…
A:
Q: Al random sample of companies in electric utilities (1), financial services (II), and food…
A: The one way anova is used to test whether any significance difference between the means of more than…
Q: 10 The following table shows the frequency distribution of the number of children at a childcare…
A:
Q: Consider the following hypothesis test. Ho: HosO Hai Hd>0 (a) The following data are from matched…
A: Thank you for posting the question. As your question has more than 3 parts, as per the policy, we…
Q: 1. The following data gives the number of social interactions of longer than 10 minutes in one week…
A:
Q: 13.38 An experiment is conducted in which 4 treat- ments are to be compared in 5 blocks. The data…
A: Given that, the sample data from k=4 treatments separated in b=5 blocks. Now we have to test the…


Trending now
This is a popular solution!

Step by step
Solved in 3 steps with 2 images

- A Michigan study concerning preference for outdoor activities used a questionnaire with a six-point Likert-type response in which 1 designated "not important" and 6 designated "extremely important." A random sample of n1 = 41 adults were asked about fishing as an outdoor activity. The mean response was x1 = 4.9. Another random sample of n2 = 50 adults were asked about camping as an outdoor activity. For this group, the mean response was x2 = 5.7. From previous studies, it is known that ?1 = 1.6 and ?2 = 1.5. Does this indicate a difference (either way) regarding preference for camping versus preference for fishing as an outdoor activity? Use a 5% level of significance.Note: A Likert scale usually has to do with approval of or agreement with a statement in a questionnaire. For example, respondents are asked to indicate whether they "strongly agree," "agree," "disagree," or "strongly disagree" with the statement. (a) What is the level of significance? .05 State the null and alternate…In a controlled laboratory experiment, scientists at the University of Minnesota discovered that 25% of a certain strain of rats subjected to a 20% coffee bean diet and then force-fed a powerful cancer-causing chemical later developed cancerous tumors. Would we have reason to believe that the proportion of rats developing tumors when subjected to this diet has increased if the experiment were repeated and 16 of 48 rats developed tumors? Use a 0.05 level of significance.A Michigan study concerning preference for outdoor activities used a questionnaire with a six-point Likert-type response in which 1 designated "not important" and 6 designated "extremely important." A random sample of n1 = 44 adults were asked about fishing as an outdoor activity. The mean response was x1 = 4.9. Another random sample of n2 = 49 adults were asked about camping as an outdoor activity. For this group, the mean response was x2 = 4.1. From previous studies, it is known that ?1 = 1.5 and ?2 = 2.0. Does this indicate a difference (either way) regarding preference for camping versus preference for fishing as an outdoor activity? Use a 5% level of significance. Note: A Likert scale usually has to do with approval of or agreement with a statement in a questionnaire. For example, respondents are asked to indicate whether they "strongly agree," "agree," "disagree," or "strongly disagree" with the statement.
- A Michigan study concerning preference for outdoor activities used a questionnaire with a six-point Likert-type response in which 1 designated "not important" and 6 designated "extremely important." A random sample of n1 = 44 adults were asked about fishing as an outdoor activity. The mean response was x1 = 4.9. Another random sample of n2 = 49 adults were asked about camping as an outdoor activity. For this group, the mean response was x2 = 4.1. From previous studies, it is known that ?1 = 1.5 and ?2 = 2.0. Does this indicate a difference (either way) regarding preference for camping versus preference for fishing as an outdoor activity? Use a 5% level of significance. Note: A Likert scale usually has to do with approval of or agreement with a statement in a questionnaire. For example, respondents are asked to indicate whether they "strongly agree," "agree," "disagree," or "strongly disagree" with the statement. I need help with (c), sketching the distribution, (d) and (e)A Michigan study concerning preference for outdoor activities used a questionnaire with a six-point Likert-type response in which 1 designated "not important" and 6 designated "extremely important." A random sample of n1 = 44 adults were asked about fishing as an outdoor activity. The mean response was x1 = 4.9. Another random sample of n2 = 52 adults were asked about camping as an outdoor activity. For this group, the mean response was x2 = 5.7. From previous studies, it is known that ?1 = 2.0 and ?2 = 1.2. Does this indicate a difference (either way) regarding preference for camping versus preference for fishing as an outdoor activity? Use a 5% level of significance.Note: A Likert scale usually has to do with approval of or agreement with a statement in a questionnaire. For example, respondents are asked to indicate whether they "strongly agree," "agree," "disagree," or "strongly disagree" with the statement. What is the value of the sample test statistic? (Test the difference u1 −…A Michigan study concerning preference for outdoor activities used a questionnaire with a six-point Likert-type response in which 1 designated "not important" and 6 designated "extremely important." A random sample of n1 = 45 adults were asked about fishing as an outdoor activity. The mean response was x1 = 4.9. Another random sample of n2 = 55 adults were asked about camping as an outdoor activity. For this group, the mean response was x2 = 4.0. From previous studies, it is known that σ1 = 1.5 and σ2 = 2.0. Does this indicate a difference (either way) regarding preference for camping versus preference for fishing as an outdoor activity? Use a 5% level of significance. Note: A Likert scale usually has to do with approval of or agreement with a statement in a questionnaire. For example, respondents are asked to indicate whether they "strongly agree," "agree," "disagree," or "strongly disagree" with the statement. (a) What is the level of significance? What is the value of the sample…
- A Michigan study concerning preference for outdoor activities used a questionnaire with a six-point Likert-type response in which 1 designated "not important" and 6 designated "extremely important." A random sample of n1 = 42 adults were asked about fishing as an outdoor activity. The mean response was x1 = 4.9. Another random sample of n2 = 55 adults were asked about camping as an outdoor activity. For this group, the mean response was x2 = 4.3. From previous studies, it is known that σ1 = 1.3 and σ2 = 1.2. Note: A Likert scale usually has to do with approval of or agreement with a statement in a questionnaire. For example, respondents are asked to indicate whether they "strongly agree," "agree," "disagree," or "strongly disagree" with the statement. (a) What is the value of the sample test statistic? Compute the corresponding z or t value as appropriate. (Test the difference μ1 − μ2. Round your answer to two decimal places.)(b) Find (or estimate) the P-value. (Round your answer to…On snow-covered roads, winter tires enable a car to stop in a shorter distance than if summer tires were installed. In terms of the additive model for one-way ANOVA, and for an experiment in which the mean stopping distances on a snow-covered road are measured for each of four brands of winter tires. If the data are as shown in Sheet 48, what conclusion would be reached at the 0.01 level of significance? Shett 48 Supplier A 517 484 463 452 502 447 481 500 485 566 Supplier B 479 499 488 430 482 457 424 488 526 455 Supplier C 435 443 480 465 435 430 465 514 463 510 Supplier D 526 537 443 505 468 533 481 477 490 470 Select one: a) p-value = 0.28 greater than 0.05, the average distance is different for at list two tires b) F stat = 1.86, F crit = 4.38, not enough evidence to claim that the average distance is different for at list two tires c) F ratio = 4.38, not enough evidence to claim that the average distance is different for at list two tires d) F stat = 0.68, F…A Michigan study concerning preference for outdoor activities used a questionnaire with a six-point Likert-type response in which 1 designated "not important" and 6 designated "extremely important." A random sample of n1 = 46 adults were asked about fishing as an outdoor activity. The mean response was x1 = 4.9. Another random sample of n2 = 48 adults were asked about camping as an outdoor activity. For this group, the mean response was x2 = 5.8. From previous studies, it is known that σ1 = 1.8 and σ2 = 1.9. Does this indicate a difference (either way) regarding preference for camping versus preference for fishing as an outdoor activity? Use a 5% level of significance.Note: A Likert scale usually has to do with approval of or agreement with a statement in a questionnaire. For example, respondents are asked to indicate whether they "strongly agree," "agree," "disagree," or "strongly disagree" with the statement. (a) What is the level of significance? What is the value of the sample…
- A Michigan study concerning preference for outdoor activities used a questionnaire with a six-point Likert-type response in which 1 designated "not important" and 6 designated "extremely important." A random sample of n1 = 47 adults were asked about fishing as an outdoor activity. The mean response was x1 = 4.9. Another random sample of n2 = 43 adults were asked about camping as an outdoor activity. For this group, the mean response was x2 = 5.5. From previous studies, it is known that ?1 = 1.2 and ?2 = 1.4. Does this indicate a difference (either way) regarding preference for camping versus preference for fishing as an outdoor activity? Use a 5% level of significance. Note: A Likert scale usually has to do with approval of or agreement with a statement in a questionnaire. For example, respondents are asked to indicate whether they "strongly agree," "agree," "disagree," or "strongly disagree" with the statement. a) What is the value of the sample test statistic? (Test the difference ?1…A Michigan study concerning preference for outdoor activities used a questionnaire with a six-point Likert-type response in which 1 designated "not important" and 6 designated "extremely important." A random sample of n1 = 44 adults were asked about fishing as an outdoor activity. The mean response was x1 = 4.9. Another random sample of n2 = 53 adults were asked about camping as an outdoor activity. For this group, the mean response was x2 = 5.6. From previous studies, it is known that σ1 = 1.5 and σ2 = 1.3. Does this indicate a difference (either way) regarding preference for camping versus preference for fishing as an outdoor activity? Use a 5% level of significance.Note: A Likert scale usually has to do with approval of or agreement with a statement in a questionnaire. For example, respondents are asked to indicate whether they "strongly agree," "agree," "disagree," or "strongly disagree" with the statement. ) What is the level of significance? What is the value of the sample test…A random sample of Engineering and Architecture students of a university were interviewed to determine if there is an association between study habits and academic performance. The results were tabulated below. Students Favourable Neutral Unfavourable Engineering 80 60 70 Architecture 100 50 70 Test the hypothesis that there is no significant difference between the study habits and academic performance using a 0.05 level of significance.


