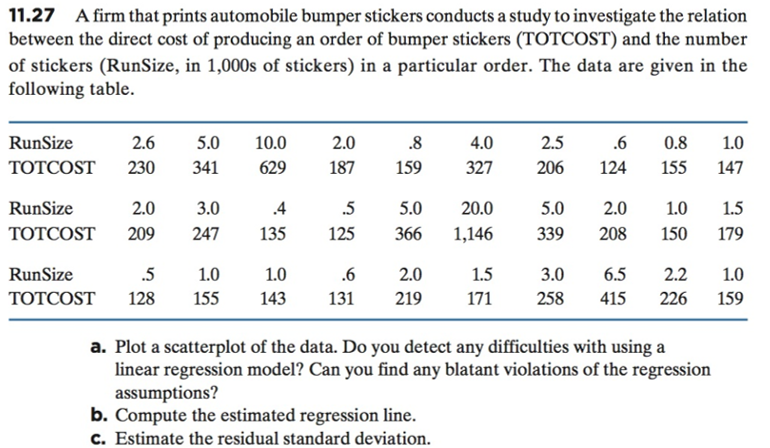
11.27 A firm that prints automobile bumper stickers conducts a study to investigate the relation between the direct cost of producing an order of bumper stickers (TOTCOST) and the number of stickers (RunSize, in 1,000s of stickers) in a particular order. The data are given in the following table. RunSize 4.0 327 2.5 2.6 5.0 10.0 TOTCOST 230 341 629 6 0.8 1.0 206 124 155 147 5.0 2.0 1.0 1.5 TOTCOST 209 247 135 125 366 1,146339208150 179 3.0 6.5 2.2 1.0 258 415 226 159 2.0 .8 RunSize 2.0 3.0 .4 .5 5.0 20.0 1.0 TOTCOST 128 155 143 RunSize .5 1.0 2.0 1.5 a. Plot a scatterplot of the data. Do you detect any difficulties with using a linear regression model? Can you find any blatant violations of the regression assumptions? b. Compute the estimated regression line. C. Estimate the residual standard deviation
11.27 A firm that prints automobile bumper stickers conducts a study to investigate the relation between the direct cost of producing an order of bumper stickers (TOTCOST) and the number of stickers (RunSize, in 1,000s of stickers) in a particular order. The data are given in the following table. RunSize 4.0 327 2.5 2.6 5.0 10.0 TOTCOST 230 341 629 6 0.8 1.0 206 124 155 147 5.0 2.0 1.0 1.5 TOTCOST 209 247 135 125 366 1,146339208150 179 3.0 6.5 2.2 1.0 258 415 226 159 2.0 .8 RunSize 2.0 3.0 .4 .5 5.0 20.0 1.0 TOTCOST 128 155 143 RunSize .5 1.0 2.0 1.5 a. Plot a scatterplot of the data. Do you detect any difficulties with using a linear regression model? Can you find any blatant violations of the regression assumptions? b. Compute the estimated regression line. C. Estimate the residual standard deviation

MATLAB: An Introduction with Applications
6th Edition
ISBN:9781119256830
Author:Amos Gilat
Publisher:Amos Gilat
Chapter1: Starting With Matlab
Section: Chapter Questions
Problem 1P

Related questions
Question
Transcribed Image Text:11.27 A firm that prints automobile bumper stickers conducts a study to investigate the relation
between the direct cost of producing an order of bumper stickers (TOTCOST) and the number
of stickers (RunSize, in 1,000s of stickers) in a particular order. The data are given in the
following table.
RunSize
4.0
327
2.5
2.6 5.0 10.0
TOTCOST 230 341 629
6 0.8 1.0
206 124 155 147
5.0 2.0 1.0 1.5
TOTCOST 209 247 135 125 366 1,146339208150 179
3.0 6.5 2.2 1.0
258 415 226 159
2.0
.8
RunSize
2.0 3.0
.4
.5
5.0 20.0
1.0
TOTCOST 128 155 143
RunSize
.5
1.0
2.0
1.5
a. Plot a scatterplot of the data. Do you detect any difficulties with using a
linear regression model? Can you find any blatant violations of the regression
assumptions?
b. Compute the estimated regression line.
C. Estimate the residual standard deviation
Expert Solution
This question has been solved!
Explore an expertly crafted, step-by-step solution for a thorough understanding of key concepts.

This is a popular solution!

Trending now
This is a popular solution!

Step by step
Solved in 4 steps with 4 images

Recommended textbooks for you
MATLAB: An Introduction with Applications
Statistics
ISBN:
9781119256830
Author:
Amos Gilat
Publisher:
John Wiley & Sons Inc

Probability and Statistics for Engineering and th…
Statistics
ISBN:
9781305251809
Author:
Jay L. Devore
Publisher:
Cengage Learning

Statistics for The Behavioral Sciences (MindTap C…
Statistics
ISBN:
9781305504912
Author:
Frederick J Gravetter, Larry B. Wallnau
Publisher:
Cengage Learning
MATLAB: An Introduction with Applications
Statistics
ISBN:
9781119256830
Author:
Amos Gilat
Publisher:
John Wiley & Sons Inc
Probability and Statistics for Engineering and th…
Statistics
ISBN:
9781305251809
Author:
Jay L. Devore
Publisher:
Cengage Learning
Statistics for The Behavioral Sciences (MindTap C…
Statistics
ISBN:
9781305504912
Author:
Frederick J Gravetter, Larry B. Wallnau
Publisher:
Cengage Learning

Elementary Statistics: Picturing the World (7th E…
Statistics
ISBN:
9780134683416
Author:
Ron Larson, Betsy Farber
Publisher:
PEARSON

The Basic Practice of Statistics
Statistics
ISBN:
9781319042578
Author:
David S. Moore, William I. Notz, Michael A. Fligner
Publisher:
W. H. Freeman

Introduction to the Practice of Statistics
Statistics
ISBN:
9781319013387
Author:
David S. Moore, George P. McCabe, Bruce A. Craig
Publisher:
W. H. Freeman