11.29 The following table gives the distributions of grades for three professors for a few randomly selected classes that each of them taught during the last 2 years Professor Miller Smith Мoore 18 36 20 25 15 44 Grade 73 85 82 D and F 17 12 8 Using a 2.5% significance level, test the null hypothesis that the grade distributions are homogeneous for these three professors AB
11.29 The following table gives the distributions of grades for three professors for a few randomly selected classes that each of them taught during the last 2 years Professor Miller Smith Мoore 18 36 20 25 15 44 Grade 73 85 82 D and F 17 12 8 Using a 2.5% significance level, test the null hypothesis that the grade distributions are homogeneous for these three professors AB

MATLAB: An Introduction with Applications
6th Edition
ISBN:9781119256830
Author:Amos Gilat
Publisher:Amos Gilat
Chapter1: Starting With Matlab
Section: Chapter Questions
Problem 1P

Related questions
Question
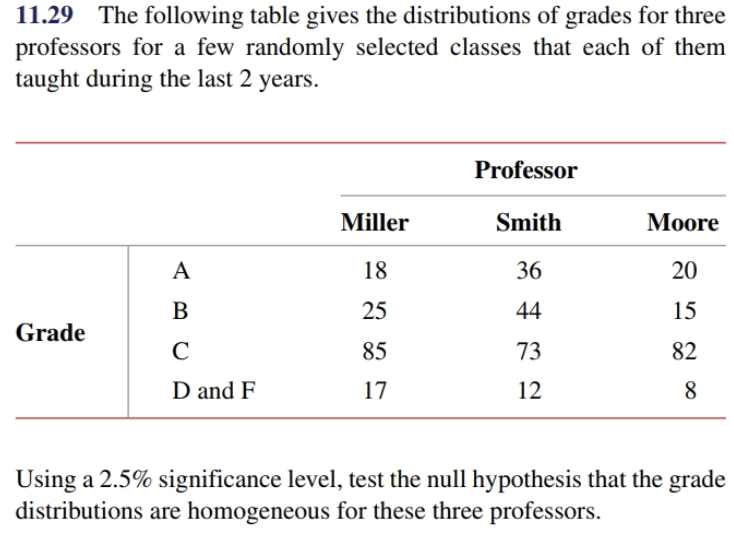
Transcribed Image Text:11.29 The following table gives the distributions of grades for three
professors for a few randomly selected classes that each of them
taught during the last 2 years
Professor
Miller
Smith
Мoore
18
36
20
25
15
44
Grade
73
85
82
D and F
17
12
8
Using a 2.5% significance level, test the null hypothesis that the grade
distributions are homogeneous for these three professors
AB
Expert Solution
This question has been solved!
Explore an expertly crafted, step-by-step solution for a thorough understanding of key concepts.

This is a popular solution!

Trending now
This is a popular solution!

Step by step
Solved in 2 steps with 1 images

Recommended textbooks for you
MATLAB: An Introduction with Applications
Statistics
ISBN:
9781119256830
Author:
Amos Gilat
Publisher:
John Wiley & Sons Inc

Probability and Statistics for Engineering and th…
Statistics
ISBN:
9781305251809
Author:
Jay L. Devore
Publisher:
Cengage Learning

Statistics for The Behavioral Sciences (MindTap C…
Statistics
ISBN:
9781305504912
Author:
Frederick J Gravetter, Larry B. Wallnau
Publisher:
Cengage Learning
MATLAB: An Introduction with Applications
Statistics
ISBN:
9781119256830
Author:
Amos Gilat
Publisher:
John Wiley & Sons Inc
Probability and Statistics for Engineering and th…
Statistics
ISBN:
9781305251809
Author:
Jay L. Devore
Publisher:
Cengage Learning
Statistics for The Behavioral Sciences (MindTap C…
Statistics
ISBN:
9781305504912
Author:
Frederick J Gravetter, Larry B. Wallnau
Publisher:
Cengage Learning

Elementary Statistics: Picturing the World (7th E…
Statistics
ISBN:
9780134683416
Author:
Ron Larson, Betsy Farber
Publisher:
PEARSON

The Basic Practice of Statistics
Statistics
ISBN:
9781319042578
Author:
David S. Moore, William I. Notz, Michael A. Fligner
Publisher:
W. H. Freeman

Introduction to the Practice of Statistics
Statistics
ISBN:
9781319013387
Author:
David S. Moore, George P. McCabe, Bruce A. Craig
Publisher:
W. H. Freeman