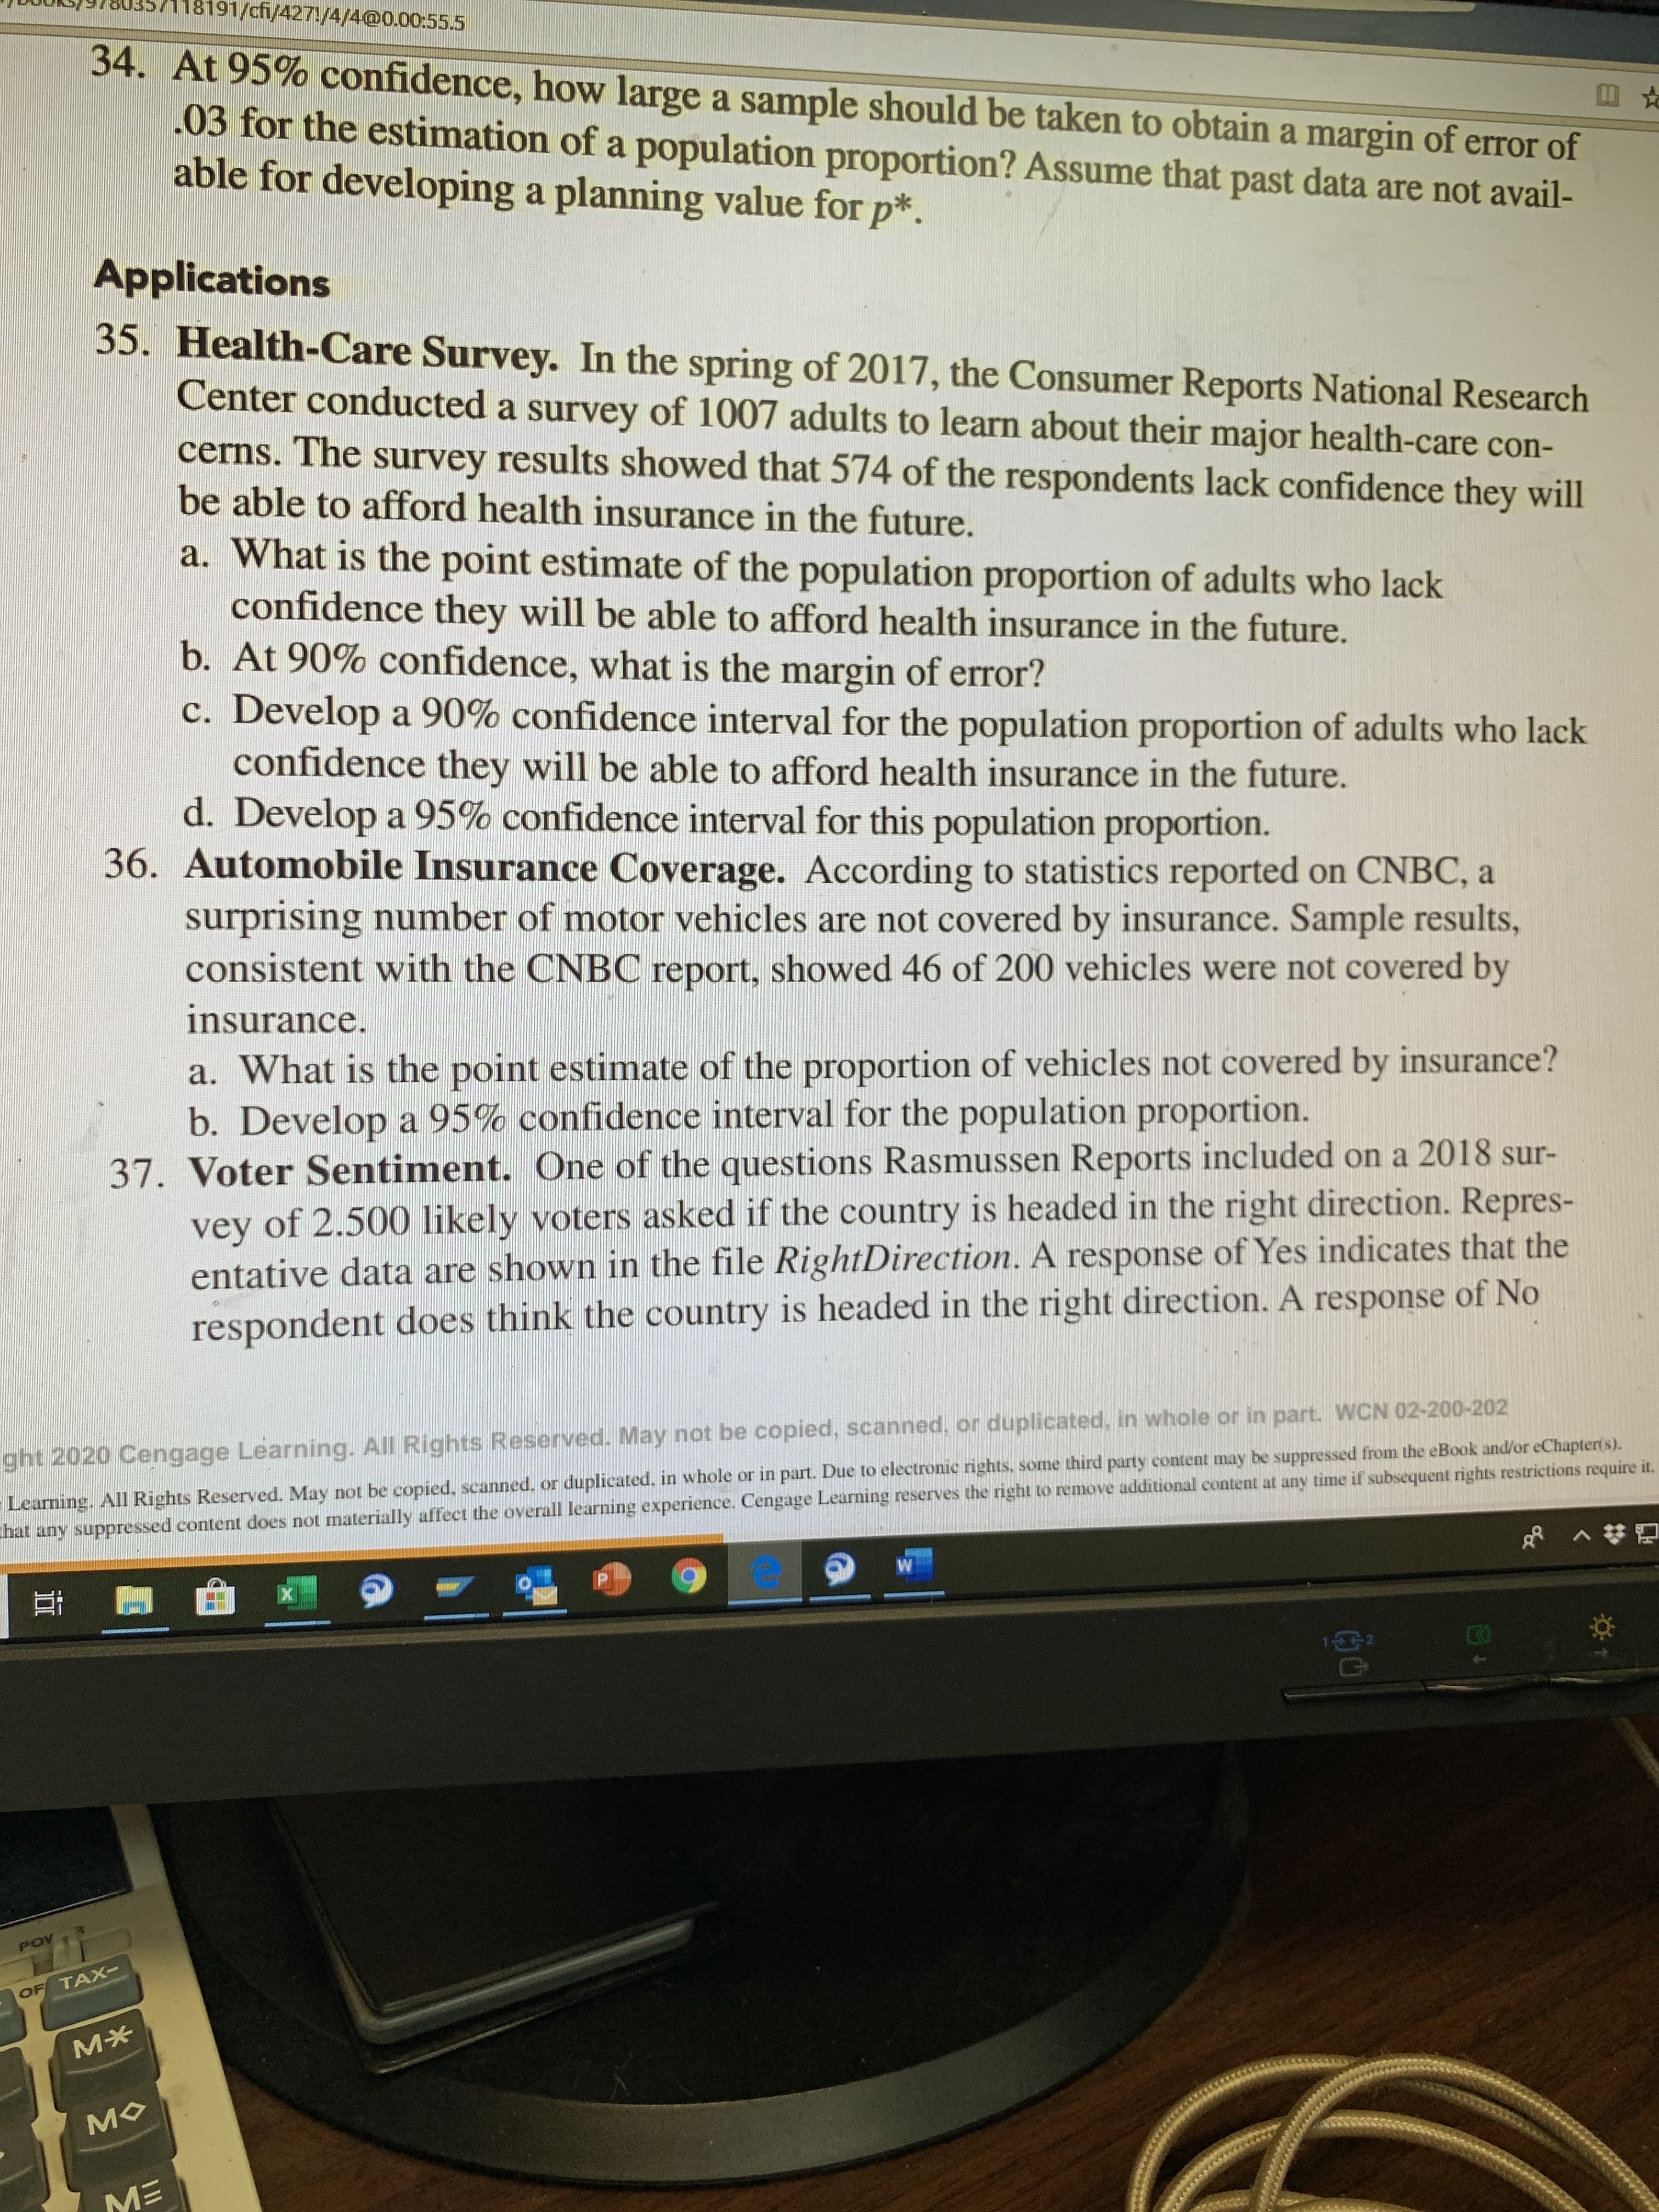
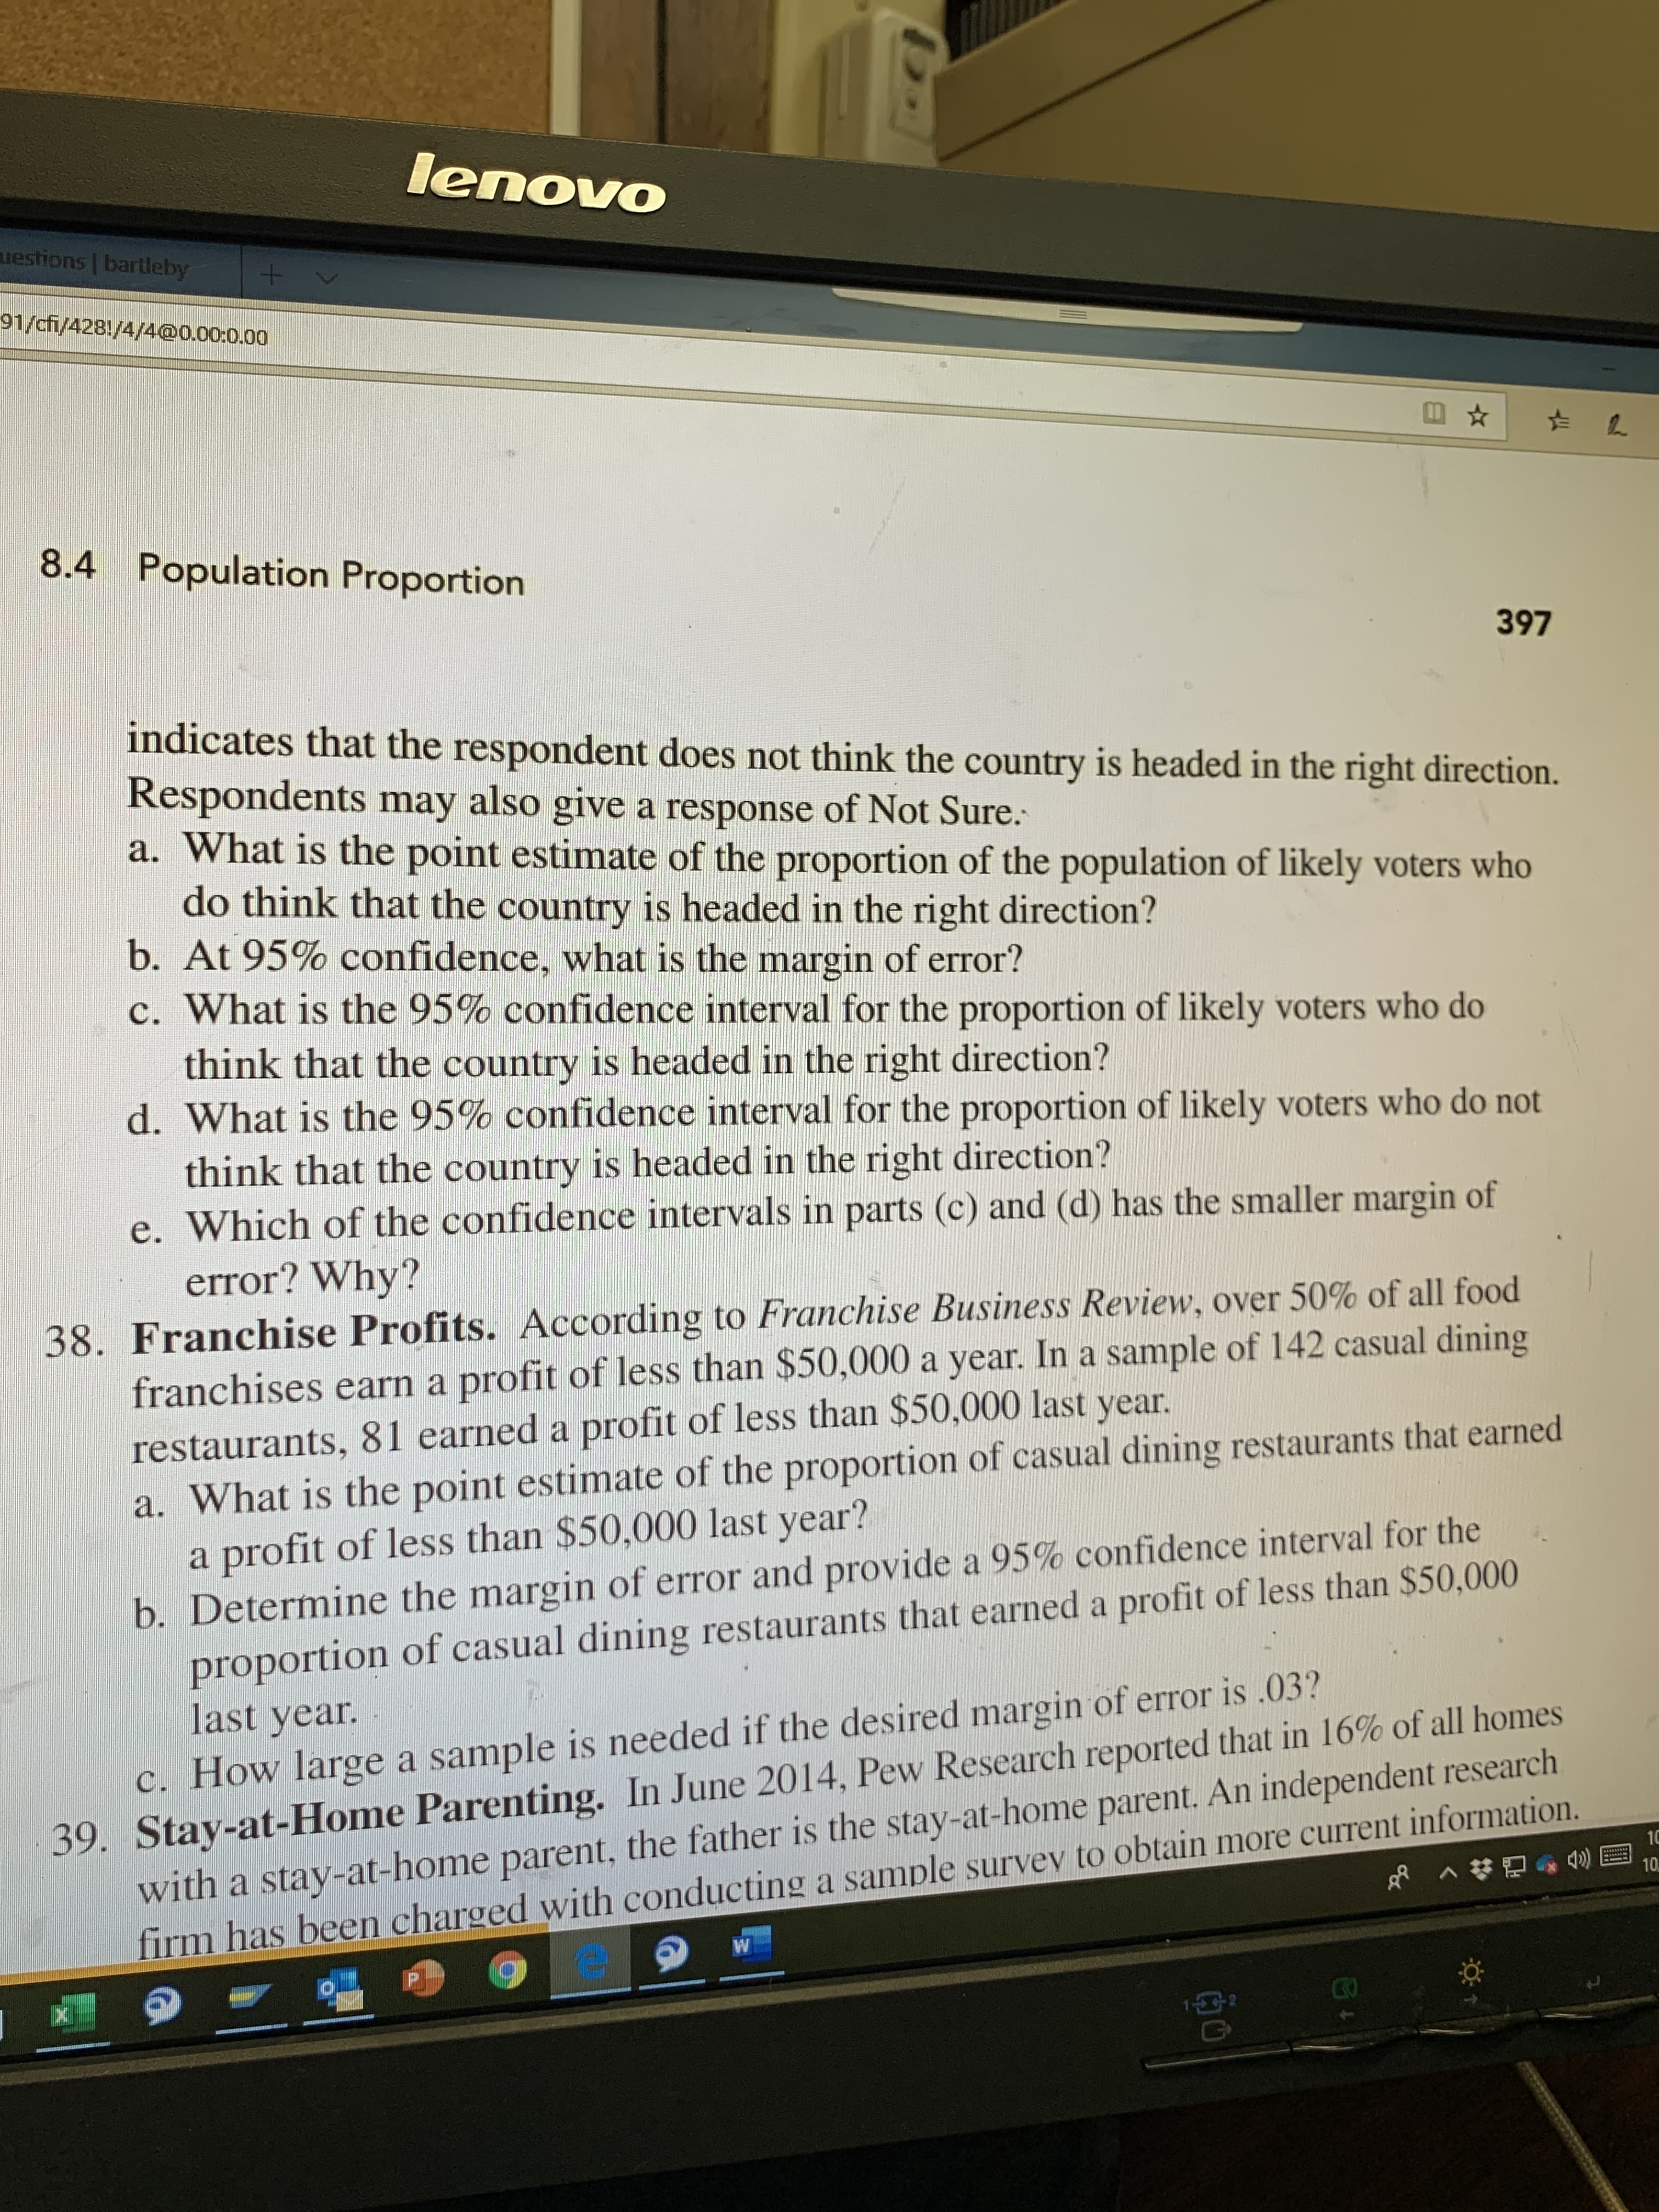
118191/cfi/427/4/4@0.00:55.5 34. At 95% confidence, how large a sample should be taken to obtain a margin of error of .03 for the estimation of a population proportion? Assume that past data are not avail- able for developing a planning value for p*. Applications 35. Health-Care Survey. In the spring of 2017, the Consumer Reports National Research Center conducted a survey of 1007 adults to learn about their major health-care con- cerns. The survey results showed that 574 of the respondents lack confidence they will be able to afford health insurance in the future. a. What is the point estimate of the population proportion of adults who lack confidence they will be able to afford health insurance in the future. b. At 90% confidence, what is the margin of error? c. Develop a 90% confidence interval for the population proportion of adults who lack confidence they will be able to afford health insurance in the future. d. Develop a 95% confidence interval for this population proportion. 36. Automobile Insurance Coverage. According to statistics reported on CNBC, a surprising number of motor vehicles are not covered by insurance. Sample results, consistent with the CNBC report, showed 46 of 200 vehicles were not covered by insurance. a. What is the point estimate of the proportion of vehicles not covered by insurance? b. Develop a 95% confidence interval for the population proportion. 37. Voter Sentiment. One of the questions Rasmussen Reports included on a 2018 sur- vey of 2.500 likely voters asked if the country is headed in the right direction. Repres- entative data are shown in the file RightDirection. A response of Yes indicates that the respondent does think the country is headed in the right direction. A response of No ght 2020 Cengage Learning. All Rights Reserved. May not be copied, scanned, or duplicated, in whole or in part. WCN 02-200-202 Learning. All Rights Reserved. May not be copied, scanned. or duplicated, in whole or in part. Due to electronic rights, some third party content may be suppressed from the eBook and/or eChapter(s). hat any suppressed content does not materially affect the overall learning experience. Cengage Learning reserves the right to remove additional content at any time if subsequent rights restrictions require it. W X POV OF TAX- M* MO M lenovo uestions bartleby + 91/cfi/4281/4/4@0.00:0.00 8.4 Population Proportion 397 indicates that the respondent does not think the country is headed in the right direction. Respondents may also give a response of Not Sure. What is the point estimate of the proportion of the population of likely voters who do think that the country is headed in the right direction? b. At 95% confidence, what is the margin of error? What is the 95% confidence interval for the proportion of likely voters who do think that the country is headed in the right direction? d. What is the 95 % confidence interval for the proportion of likely voters who do not think that the country is headed in the right direction? e. Which of the confidence intervals in parts (c) and (d) has the smaller margin of error? Why? 38. Franchise Profits. According to Franchise Business Review, over 50% of all food franchises earn a profit of less than $50,000 a year. In a sample of 142 casual dining restaurants, 81 earned a profit of less than $50,000 last year. a. What is the point estimate of the proportion of casual dining restaurants that earned a profit of less than $50,000 last year? b. Determine the margin of error and provide a 95% confidence interval for the proportion of casual dining restaurants that earned a profit of less than $50,000 last year. c. How large a sample is needed if the desired margin of error is .03? 39. Stay-at-Home Parenting. In June 2014, Pew Research reported that in 16% of all homes with a stay-at-home parent, the father is the stay-at-home parent. An independent research firm has been charged with conducting a sample survey to obtain more current information. 10 10 1P


Addition Rule of Probability
It simply refers to the likelihood of an event taking place whenever the occurrence of an event is uncertain. The probability of a single event can be calculated by dividing the number of successful trials of that event by the total number of trials.
Expected Value
When a large number of trials are performed for any random variable ‘X’, the predicted result is most likely the mean of all the outcomes for the random variable and it is known as expected value also known as expectation. The expected value, also known as the expectation, is denoted by: E(X).
Probability Distributions
Understanding probability is necessary to know the probability distributions. In statistics, probability is how the uncertainty of an event is measured. This event can be anything. The most common examples include tossing a coin, rolling a die, or choosing a card. Each of these events has multiple possibilities. Every such possibility is measured with the help of probability. To be more precise, the probability is used for calculating the occurrence of events that may or may not happen. Probability does not give sure results. Unless the probability of any event is 1, the different outcomes may or may not happen in real life, regardless of how less or how more their probability is.
Basic Probability
The simple definition of probability it is a chance of the occurrence of an event. It is defined in numerical form and the probability value is between 0 to 1. The probability value 0 indicates that there is no chance of that event occurring and the probability value 1 indicates that the event will occur. Sum of the probability value must be 1. The probability value is never a negative number. If it happens, then recheck the calculation.
I need help with problem 37 d and e
This is the data set!
|
Right Direction? |
|
Not Sure |
|
Yes |
|
No |
|
Yes |
|
No |
|
No |
|
Yes |
|
Yes |
|
No |
|
No |
|
Yes |
|
No |
|
No |
|
Not Sure |
|
Yes |
|
No |
|
No |
|
No |
|
Yes |
|
No |
|
Not Sure |
|
No |
|
Yes |
|
Yes |
|
Yes |
|
No |
|
No |
|
Yes |
|
No |
|
No |
|
No |
|
Not Sure |
|
Yes |
|
Yes |
|
Yes |
|
No |
|
Yes |
|
No |
|
Yes |
|
No |
|
Yes |
|
Yes |
|
No |
|
No |
|
Yes |
|
No |
|
Not Sure |
|
No |
|
No |
|
No |
|
Yes |
|
Not Sure |
|
Yes |
|
Yes |
|
No |
|
No |
|
No |
|
No |
|
Yes |
|
Not Sure |
|
No |
|
No |
|
No |
|
No |
|
Yes |
|
No |
|
No |
|
Yes |
|
Yes |
|
Yes |
|
No |
|
Yes |
|
No |
|
No |
|
No |
|
Yes |
|
No |
|
Yes |
|
Yes |
|
Yes |
|
No |
|
No |
|
Yes |
|
Yes |
|
Yes |
|
Yes |
|
Yes |
|
No |
|
No |
|
No |
|
No |
|
Yes |
|
No |
|
Yes |
|
Yes |
|
No |
|
Yes |
|
No |
|
Yes |
|
Yes |
|
Yes |
|
No |
|
No |
|
Yes |
|
No |
|
No |
|
Yes |
|
Yes |
|
Yes |
|
Yes |
|
No |
|
Yes |
|
No |
|
No |
|
No |
|
Yes |
|
Yes |
|
No |
|
No |
|
No |
|
No |
|
Yes |
|
No |
|
Yes |
|
Yes |
|
Yes |
|
No |
|
No |
|
No |
|
No |
|
No |
|
Yes |
|
Yes |
|
No |
|
No |
|
Yes |
|
No |
|
No |
|
No |
|
No |
|
Yes |
|
Yes |
|
Not Sure |
|
No |
|
Yes |
|
No |
|
Yes |
|
Yes |
|
No |
|
Yes |
|
No |
|
Yes |
|
No |
|
No |
|
Yes |
|
No |
|
Yes |
|
Yes |
|
Yes |
|
No |
|
No |
|
No |
|
No |
|
No |
|
Yes |
|
Yes |
|
Yes |
|
No |
|
Yes |
|
No |
|
No |
|
Yes |
|
No |
|
No |
|
Yes |
|
No |
|
Yes |
|
Yes |
|
Yes |
|
No |
|
Yes |
|
No |
|
No |
|
Not Sure |
|
Not Sure |
|
No |
|
No |
|
Not Sure |
|
No |
|
No |
|
No |
|
No |
|
No |
|
Yes |
|
Yes |
|
No |
|
No |
|
Not Sure |
|
No |
|
Yes |
|
No |
|
Yes |
|
No |
|
Yes |
|
No |
|
Yes |
|
Not Sure |
|
Not Sure |
|
No |
|
Yes |
|
Yes |
|
Yes |
|
Yes |
|
Yes |
|
Not Sure |
|
Yes |
|
No |
|
Yes |
|
Yes |
|
Not Sure |
|
Not Sure |
|
No |
|
Yes |
|
Yes |
|
Yes |
|
No |
|
No |
|
No |
|
No |
|
No |
|
No |
|
Not Sure |
|
No |
|
Yes |
|
Yes |
|
Yes |
|
No |
|
Yes |
|
No |
|
No |
|
No |
|
No |
|
Yes |
|
No |
|
Yes |
|
No |
|
Yes |
|
No |
|
Yes |
|
No |
|
No |
|
No |
|
Not Sure |
|
Yes |
|
No |
|
No |
|
No |
|
Not Sure |
|
No |
|
Yes |
|
Yes |
|
Yes |
|
No |
|
No |
|
Not Sure |
|
No |
|
Yes |
|
No |
|
No |
|
No |
|
Not Sure |
|
Yes |
|
No |
|
No |
|
Yes |
|
Yes |
|
Yes |
|
Yes |
|
No |
|
No |
|
No |
|
No |
|
Not Sure |
|
No |
|
No |
|
Yes |
|
Yes |
|
No |
|
Yes |
|
Yes |
|
Yes |
|
Yes |
|
No |
|
No |
|
No |
|
Yes |
|
No |
|
No |
|
Yes |
|
No |
|
Yes |
|
No |
|
No |
|
No |
|
Yes |
|
Yes |
|
Not Sure |
|
Yes |
|
No |
|
No |
|
Yes |
|
Yes |
|
No |
|
Yes |
|
Yes |
|
Yes |
|
No |
|
No |
|
No |
|
No |
|
No |
|
Yes |
|
Yes |
|
Yes |
|
Yes |
|
No |
|
No |
|
Yes |
|
Yes |
|
Yes |
|
Yes |
|
Yes |
|
No |
|
No |
|
No |
|
Yes |
|
Yes |
|
No |
|
Yes |
|
Yes |
|
Yes |
|
No |
|
No |
|
No |
|
Yes |
|
No |
|
Yes |
|
Not Sure |
|
Yes |
|
No |
|
Yes |
|
No |
|
No |
|
No |
|
Yes |
|
Yes |
|
Yes |
|
No |
|
Yes |
|
No |
|
Yes |
|
Yes |
|
No |
|
Yes |
|
No |
|
No |
|
Yes |
|
Yes |
|
No |
|
No |
|
No |
|
No |
|
No |
|
No |
|
No |
|
No |
|
No |
|
Yes |
|
No |
|
No |
|
Yes |
|
No |
|
Yes |
|
No |
|
Not Sure |
|
No |
|
Yes |
|
No |
|
Yes |
|
Not Sure |
|
Yes |
|
No |
|
No |
|
No |
|
No |
|
Yes |
|
No |
|
No |
|
No |
|
No |
|
No |
|
Yes |
|
Yes |
|
No |
|
No |
|
No |
|
Yes |
|
No |
|
No |
|
Yes |
|
Yes |
|
Yes |
|
No |
|
No |
|
Yes |
|
No |
|
No |
|
No |
|
No |
|
No |
|
Yes |
|
Yes |
|
Yes |
|
No |
|
Yes |
|
Yes |
|
Yes |
|
Yes |
|
No |
|
Yes |
|
Not Sure |
|
Yes |
|
No |
|
Not Sure |
|
Yes |
|
Yes |
|
No |
|
Yes |
|
No |
|
No |
|
No |
|
Yes |
|
No |
|
Yes |
|
Yes |
|
No |
|
No |
|
Not Sure |
|
No |
|
No |
|
Yes |
|
Yes |
|
Yes |
|
No |
|
No |
|
Yes |
|
No |
|
No |
|
No |
|
Not Sure |
|
No |
|
Not Sure |
|
No |
|
No |
|
No |
|
Yes |
|
No |
|
Yes |
|
No |
|
Yes |
|
No |
|
Yes |
|
Yes |
|
No |
|
Yes |
|
Yes |
|
No |
|
No |
|
No |
|
Yes |
|
No |
|
No |
|
Not Sure |
|
No |
|
Yes |
|
No |
|
No |
|
No |
|
No |
|
Yes |
|
Yes |
|
Yes |
|
No |
|
No |
|
No |
|
Yes |
|
No |
|
Yes |
|
No |
|
Yes |
|
No |
|
No |
|
Yes |
|
No |
|
No |
|
No |
|
No |
|
Yes |
|
Yes |
|
Yes |
|
No |
|
No |
|
No |
|
No |
|
No |
|
Yes |
|
No |
|
No |
|
Yes |
|
Yes |
|
No |
|
Yes |
|
Yes |
|
Not Sure |
|
No |
|
No |
|
No |
|
No |
|
No |
|
Not Sure |
|
Yes |
|
No |
|
Not Sure |
|
Yes |
|
No |
|
No |
|
Yes |
|
Yes |
|
No |
|
No |
|
No |
|
No |
|
No |
|
Yes |
|
No |
|
No |
|
Not Sure |
|
No |
|
No |
|
No |
|
No |
|
Yes |
|
Yes |
|
Yes |
|
No |
|
Yes |
|
Yes |
|
Not Sure |
|
No |
|
No |
|
No |
|
No |
|
No |
|
No |
|
No |
|
Yes |
|
No |
|
No |
|
Yes |
|
No |
|
Yes |
|
Yes |
|
Yes |
|
No |
|
No |
|
No |
|
No |
|
Yes |
|
No |
|
No |
|
Yes |
|
No |
|
No |
|
No |
|
Yes |
|
Yes |
|
Yes |
|
Yes |
|
No |
|
Yes |
|
Yes |
|
Yes |
|
Not Sure |
|
Yes |
|
No |
|
No |
|
Not Sure |
|
Yes |
|
No |
|
No |
|
Yes |
|
No |
|
No |
|
Yes |
|
Yes |
|
No |
|
No |
|
No |
|
No |
|
Yes |
|
No |
|
No |
|
No |
|
No |
|
Yes |
|
Yes |
|
No |
|
No |
|
No |
|
No |
|
Not Sure |
|
Yes |
|
No |
|
No |
|
Yes |
|
Yes |
|
No |
|
Not Sure |
|
Yes |
|
Yes |
|
No |
|
No |
|
No |
|
No |
|
No |
|
Yes |
|
No |
|
Yes |
|
No |
|
Yes |
|
No |
|
Yes |
|
Yes |
|
Yes |
|
No |
|
No |
|
No |
|
No |
|
No |
|
Not Sure |
|
No |
|
No |
|
No |
|
Yes |
|
Not Sure |
|
Yes |
|
No |
|
No |
|
Yes |
|
No |
|
Yes |
|
Yes |
|
No |
|
Not Sure |
|
No |
|
Yes |
|
No |
|
No |
|
No |
|
Yes |
|
No |
|
No |
|
No |
|
No |
|
Yes |
|
Yes |
|
Yes |
|
Yes |
|
No |
|
Yes |
|
Yes |
|
Yes |
|
No |
|
No |
|
No |
|
Yes |
|
No |
|
No |
|
No |
|
Yes |
|
No |
|
Yes |
|
No |
|
Not Sure |
|
No |
|
Yes |
|
No |
|
No |
|
Yes |
|
Not Sure |
|
No |
|
No |
|
Yes |
|
Yes |
|
Yes |
|
Yes |
|
No |
|
Yes |
|
No |
|
Yes |
|
Not Sure |
|
No |
|
No |
|
Yes |
|
No |
|
Yes |
|
No |
|
Yes |
|
No |
|
Yes |
|
No |
|
Yes |
|
No |
|
No |
|
No |
|
Yes |
|
Yes |
|
Yes |
|
Yes |
|
Yes |
|
No |
|
Yes |
|
Not Sure |
|
No |
|
Yes |
|
No |
|
No |
|
No |
|
Yes |
|
Yes |
|
Yes |
|
No |
|
Yes |
|
Not Sure |
|
Yes |
|
No |
|
No |
|
Yes |
|
Yes |
|
Yes |
|
Yes |
|
No |
|
Not Sure |
|
Yes |
|
No |
|
No |
|
Yes |
|
No |
|
No |
|
No |
|
No |
|
No |
|
No |
|
No |
|
No |
|
Yes |
|
Yes |
|
Yes |
|
No |
|
Yes |
|
No |
|
No |
|
No |
|
No |
|
No |
|
No |
|
No |
|
Yes |
|
No |
|
Yes |
|
Yes |
|
Not Sure |
|
No |
|
No |
|
No |
|
Yes |
|
No |
|
No |
|
Yes |
|
Yes |
|
Yes |
|
No |
|
No |
|
No |
|
Yes |
|
Yes |
|
Yes |
|
No |
|
No |
|
Yes |
|
Yes |
|
No |
|
Yes |
|
Yes |
|
Not Sure |
|
No |
|
No |
|
No |
|
No |
|
No |
|
Yes |
|
No |
|
No |
|
No |
|
No |
|
No |
|
No |
|
No |
|
Not Sure |
|
Yes |
|
Yes |
|
Yes |
|
Yes |
|
No |
|
Yes |
|
Yes |
|
Yes |
|
No |
|
Yes |
|
No |
|
No |
|
No |
|
Yes |
|
No |
|
No |
|
No |
|
Not Sure |
|
No |
|
Yes |
|
No |
|
No |
|
No |
|
Yes |
|
Yes |
|
Not Sure |
|
No |
|
Yes |
|
Yes |
|
Yes |
|
No |
|
Yes |
|
Not Sure |
|
No |
|
No |
|
No |
|
No |
|
No |
|
No |
|
Yes |
|
Yes |
|
No |
|
Yes |
|
No |
|
No |
|
No |
|
No |
|
Yes |
|
Yes |
|
Not Sure |
|
No |
|
No |
|
Yes |
|
Not Sure |
|
Yes |
|
Yes |
|
No |
|
No |
|
Not Sure |
|
Not Sure |
|
No |
|
Yes |
|
No |
|
Yes |
|
No |
|
No |
|
No |
|
No |
|
No |
|
Yes |
|
No |
|
No |
|
Yes |
|
No |
|
No |
|
Yes |
|
No |
|
No |
|
Yes |
|
No |
|
No |
|
No |
|
No |
|
No |
|
Yes |
|
No |
|
No |
|
Yes |
|
No |
|
No |
|
Yes |
|
No |
|
No |
|
No |
|
No |
|
No |
|
No |
|
Not Sure |
|
No |
|
No |
|
Yes |
|
Yes |
|
Not Sure |
|
No |
|
No |
|
No |
|
No |
|
No |
|
Not Sure |
|
No |
|
No |
|
No |
|
No |
|
Not Sure |
|
No |
|
No |
|
No |
|
No |
|
No |
|
No |
|
Yes |
|
Yes |
|
Yes |
|
No |
|
No |
|
No |
|
No |
|
Yes |
|
No |
|
No |
|
No |
|
No |
|
No |
|
No |
|
No |
|
No |
|
No |
|
Not Sure |
|
No |
|
Not Sure |
|
No |
|
No |
|
Yes |
|
Not Sure |
|
Yes |
|
Yes |
|
No |
|
No |
|
Yes |
|
No |
|
No |
|
No |
|
No |
|
Yes |
|
Yes |
|
No |
|
Yes |
|
Yes |
|
Yes |
|
Not Sure |
|
Yes |
|
Yes |
|
Yes |
|
No |
|
No |
|
Yes |
|
No |
|
No |
|
No |
|
No |
|
Yes |
|
Yes |
|
No |
|
No |
|
Yes |
|
No |
|
No |
|
No |
|
No |
|
No |
|
Yes |
|
No |
|
Yes |
|
Yes |
|
No |
|
Not Sure |
|
No |
|
No |


Trending now
This is a popular solution!

Step by step
Solved in 5 steps with 4 images


