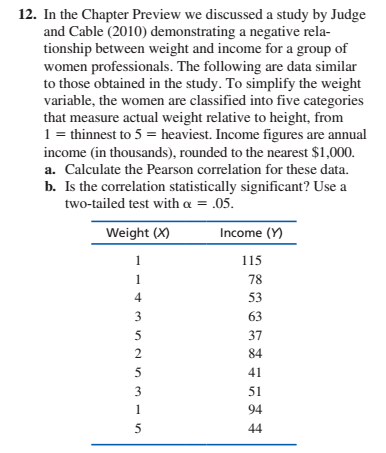
12. In the Chapter Preview we discussed a study by Judge and Cable (2010) demonstrating a negative rela- tionship between weight and income for a group of women professionals. The following are data similar to those obtained in the study. To simplify the weight variable, the women are classified into five categories that measure actual weight relative to height, from 1 = thinnest to 5 = heaviest. Income figures are annual income (in thousands), rounded to the nearest $1,000. a. Calculate the Pearson correlation for these data. b. Is the correlation statistically significant? Use a two-tailed test with a = .05. Weight (X) Income (Y) 115 78 1 4 53 3 63 37 84 5 41 3 51 94 1 44
12. In the Chapter Preview we discussed a study by Judge and Cable (2010) demonstrating a negative rela- tionship between weight and income for a group of women professionals. The following are data similar to those obtained in the study. To simplify the weight variable, the women are classified into five categories that measure actual weight relative to height, from 1 = thinnest to 5 = heaviest. Income figures are annual income (in thousands), rounded to the nearest $1,000. a. Calculate the Pearson correlation for these data. b. Is the correlation statistically significant? Use a two-tailed test with a = .05. Weight (X) Income (Y) 115 78 1 4 53 3 63 37 84 5 41 3 51 94 1 44

Glencoe Algebra 1, Student Edition, 9780079039897, 0079039898, 2018
18th Edition
ISBN:9780079039897
Author:Carter
Publisher:Carter
Chapter4: Equations Of Linear Functions
Section4.5: Correlation And Causation
Problem 24PFA

Related questions
Question
Transcribed Image Text:12. In the Chapter Preview we discussed a study by Judge
and Cable (2010) demonstrating a negative rela-
tionship between weight and income for a group of
women professionals. The following are data similar
to those obtained in the study. To simplify the weight
variable, the women are classified into five categories
that measure actual weight relative to height, from
1 = thinnest to 5 = heaviest. Income figures are annual
income (in thousands), rounded to the nearest $1,000.
a. Calculate the Pearson correlation for these data.
b. Is the correlation statistically significant? Use a
two-tailed test with a = .05.
Weight (X)
Income (Y)
115
78
1
4
53
3
63
37
84
5
41
3
51
94
1
44
Expert Solution
This question has been solved!
Explore an expertly crafted, step-by-step solution for a thorough understanding of key concepts.

This is a popular solution!

Trending now
This is a popular solution!

Step by step
Solved in 3 steps with 2 images

Recommended textbooks for you
Glencoe Algebra 1, Student Edition, 9780079039897…
Algebra
ISBN:
9780079039897
Author:
Carter
Publisher:
McGraw Hill
Glencoe Algebra 1, Student Edition, 9780079039897…
Algebra
ISBN:
9780079039897
Author:
Carter
Publisher:
McGraw Hill