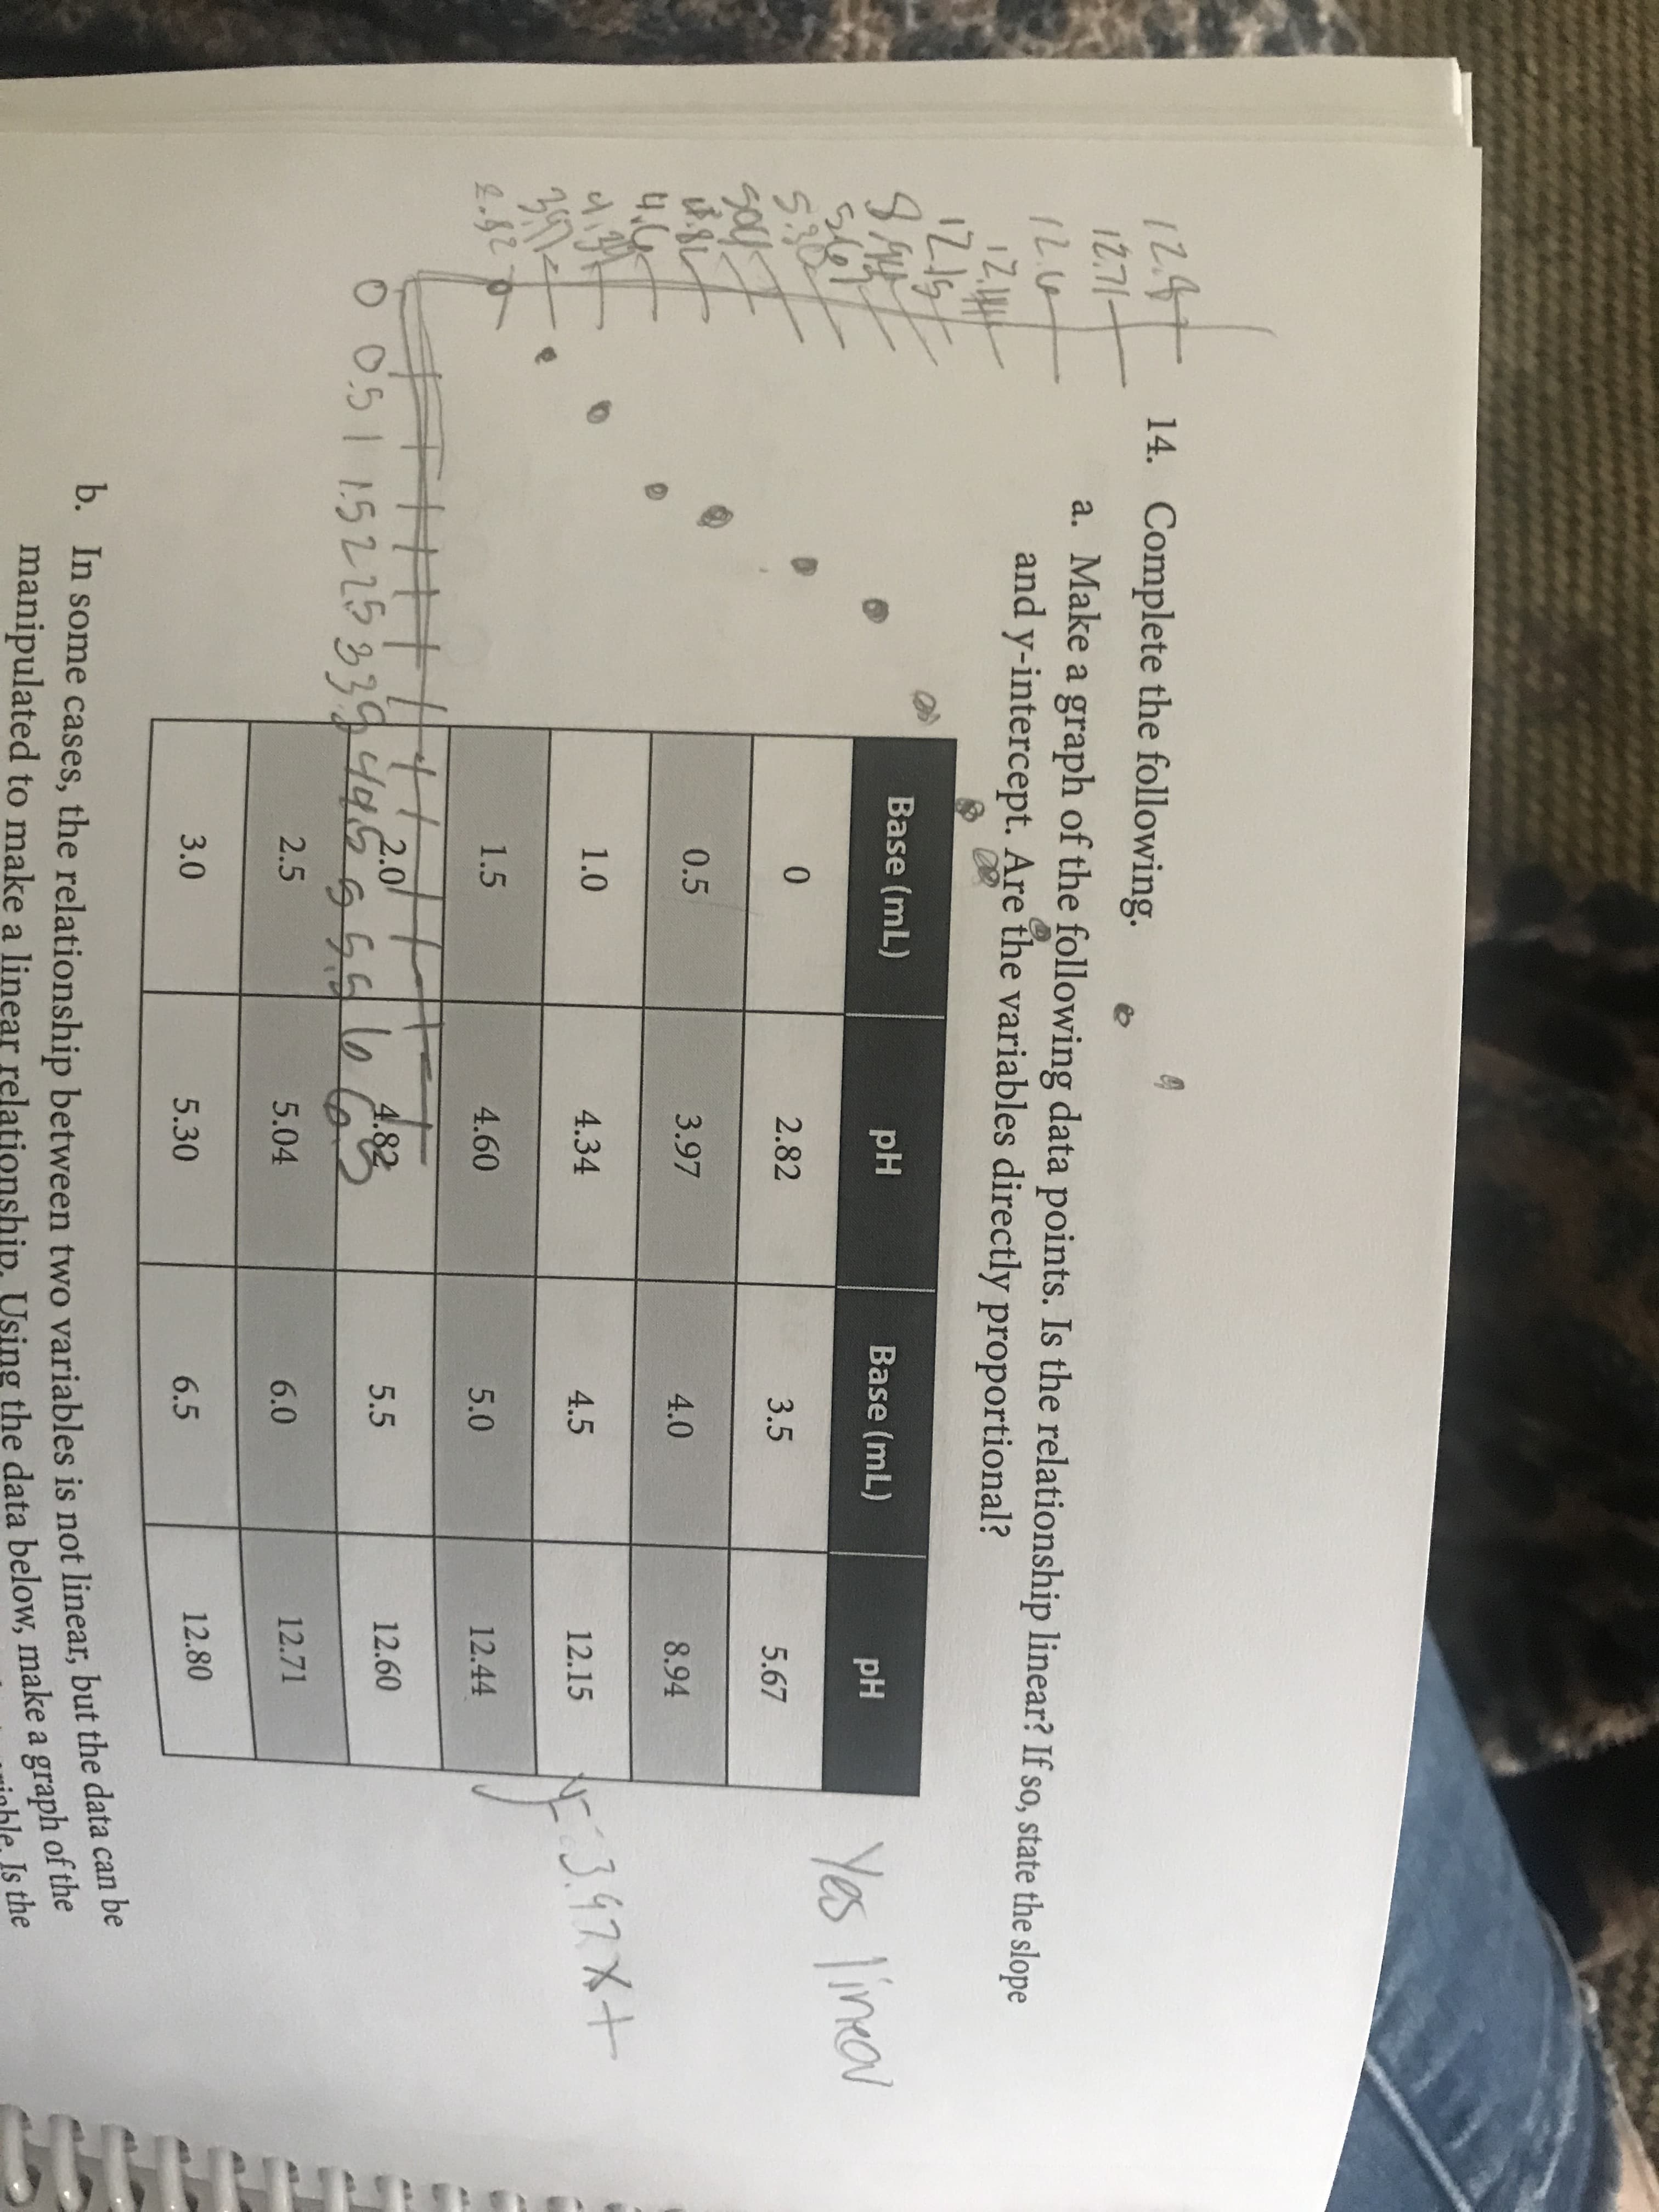
1247 14. Complete the following. 12.71- a. Make a graph of the following data points. Is the relationship linear? If so, state the slope and y-intercept. Are the variables directly proportional? Base (mL) pH Base (mL) s67 5.30 pH Yes lineov 2.82 3.5 5.67 0.5 3.97 4.0 8.94 1.0 4.34 4:3.97X+ 4.5 12.15 1.5 4.60 5.0 12.44 TH1||||20 16 4.82 5.5 12.60 2.5 5.04 6.0 12.71 3.0 5.30 6.5 12.80 b. In some cases, the relationship between two variables is not linear, but the data can be manipulated to make a linear relationship. Using the data below, make a graph of the Is the
1247 14. Complete the following. 12.71- a. Make a graph of the following data points. Is the relationship linear? If so, state the slope and y-intercept. Are the variables directly proportional? Base (mL) pH Base (mL) s67 5.30 pH Yes lineov 2.82 3.5 5.67 0.5 3.97 4.0 8.94 1.0 4.34 4:3.97X+ 4.5 12.15 1.5 4.60 5.0 12.44 TH1||||20 16 4.82 5.5 12.60 2.5 5.04 6.0 12.71 3.0 5.30 6.5 12.80 b. In some cases, the relationship between two variables is not linear, but the data can be manipulated to make a linear relationship. Using the data below, make a graph of the Is the

Chapter2: Basic Statistical Analysis With Excel
Section: Chapter Questions
Problem 12P

Related questions
Question
How do I solve this? I do know that it is linear.
Transcribed Image Text:1247 14. Complete the following.
12.71-
a. Make a graph of the following data points. Is the relationship linear? If so, state the slope
and y-intercept. Are the variables directly proportional?
Base (mL)
pH
Base (mL)
s67
5.30
pH
Yes lineov
2.82
3.5
5.67
0.5
3.97
4.0
8.94
1.0
4.34
4:3.97X+
4.5
12.15
1.5
4.60
5.0
12.44
TH1||||20
16
4.82
5.5
12.60
2.5
5.04
6.0
12.71
3.0
5.30
6.5
12.80
b. In some cases, the relationship between two variables is not linear, but the data can be
manipulated to make a linear relationship. Using the data below, make a graph of the
Is the
Expert Solution
This question has been solved!
Explore an expertly crafted, step-by-step solution for a thorough understanding of key concepts.

This is a popular solution!

Trending now
This is a popular solution!

Step by step
Solved in 2 steps with 1 images

Knowledge Booster


Learn more about
Need a deep-dive on the concept behind this application? Look no further. Learn more about this topic, chemistry and related others by exploring similar questions and additional content below.Recommended textbooks for you