13% First interactions that result in a purchase 7% 3% 2% 93% Customers 'satisfied' with first interaction 82% 87% 73% 9% Preferred type of interaction 14% 38% 39% 4% First Interaction with Get Food Now 17% 33% 46% 0% 5% 10% 15% 20% 25% 30% 35% 40% 45% 50% 55% 60% 65% 70% 75% 80% 85% 90% 95% I Face-to-Face I Website I App
13% First interactions that result in a purchase 7% 3% 2% 93% Customers 'satisfied' with first interaction 82% 87% 73% 9% Preferred type of interaction 14% 38% 39% 4% First Interaction with Get Food Now 17% 33% 46% 0% 5% 10% 15% 20% 25% 30% 35% 40% 45% 50% 55% 60% 65% 70% 75% 80% 85% 90% 95% I Face-to-Face I Website I App

MATLAB: An Introduction with Applications
6th Edition
ISBN:9781119256830
Author:Amos Gilat
Publisher:Amos Gilat
Chapter1: Starting With Matlab
Section: Chapter Questions
Problem 1P

Related questions
Question
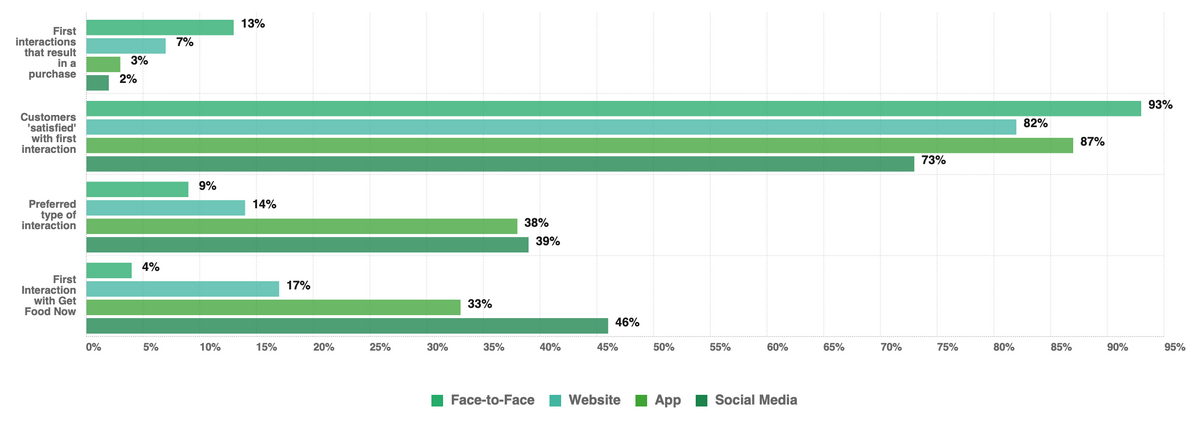
Assuming Get Food Now achieved 12,000 interactions, how many of these would have resulted in customer being less than satisfied with their first interaction?
Transcribed Image Text:13%
First
interactions
that result
in a
purchase
7%
3%
2%
93%
Customers
'satisfied'
with first
interaction
82%
87%
73%
9%
Preferred
type of
interaction
14%
38%
39%
4%
First
Interaction
with Get
Food Now
17%
33%
46%
0%
5%
10%
15%
20%
25%
30%
35%
40%
45%
50%
55%
60%
65%
70%
75%
80%
85%
90%
95%
Face-to-Face
Website
App
Social Media
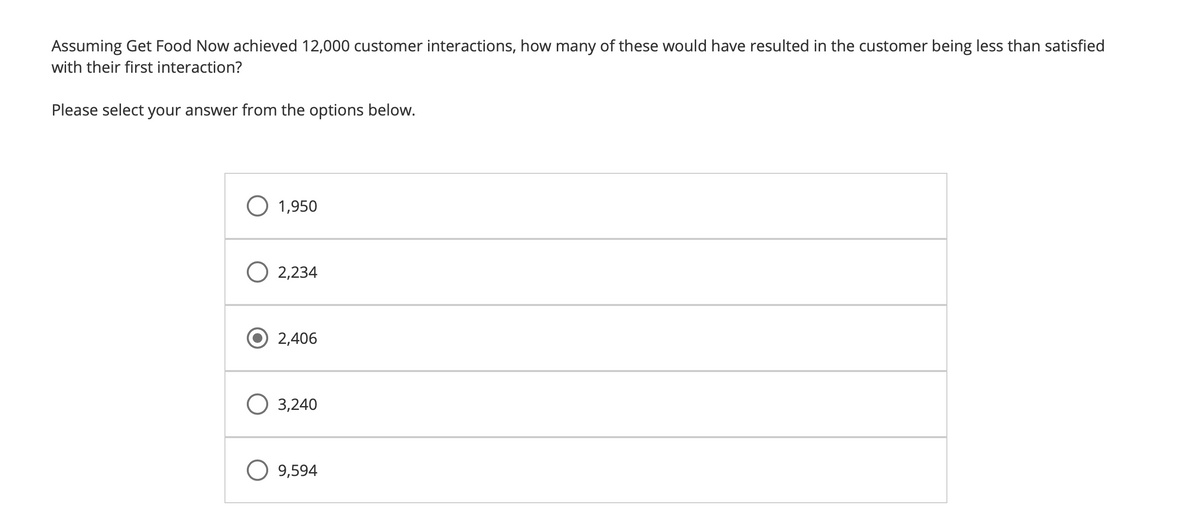
Transcribed Image Text:Assuming Get Food Now achieved 12,000 customer interactions, how many of these would have resulted in the customer being less than satisfied
with their first interaction?
Please select your answer from the options below.
O 1,950
O 2,234
2,406
O 3,240
9,594
Expert Solution
This question has been solved!
Explore an expertly crafted, step-by-step solution for a thorough understanding of key concepts.

This is a popular solution!

Trending now
This is a popular solution!

Step by step
Solved in 2 steps

Recommended textbooks for you
MATLAB: An Introduction with Applications
Statistics
ISBN:
9781119256830
Author:
Amos Gilat
Publisher:
John Wiley & Sons Inc

Probability and Statistics for Engineering and th…
Statistics
ISBN:
9781305251809
Author:
Jay L. Devore
Publisher:
Cengage Learning

Statistics for The Behavioral Sciences (MindTap C…
Statistics
ISBN:
9781305504912
Author:
Frederick J Gravetter, Larry B. Wallnau
Publisher:
Cengage Learning
MATLAB: An Introduction with Applications
Statistics
ISBN:
9781119256830
Author:
Amos Gilat
Publisher:
John Wiley & Sons Inc
Probability and Statistics for Engineering and th…
Statistics
ISBN:
9781305251809
Author:
Jay L. Devore
Publisher:
Cengage Learning
Statistics for The Behavioral Sciences (MindTap C…
Statistics
ISBN:
9781305504912
Author:
Frederick J Gravetter, Larry B. Wallnau
Publisher:
Cengage Learning

Elementary Statistics: Picturing the World (7th E…
Statistics
ISBN:
9780134683416
Author:
Ron Larson, Betsy Farber
Publisher:
PEARSON

The Basic Practice of Statistics
Statistics
ISBN:
9781319042578
Author:
David S. Moore, William I. Notz, Michael A. Fligner
Publisher:
W. H. Freeman

Introduction to the Practice of Statistics
Statistics
ISBN:
9781319013387
Author:
David S. Moore, George P. McCabe, Bruce A. Craig
Publisher:
W. H. Freeman