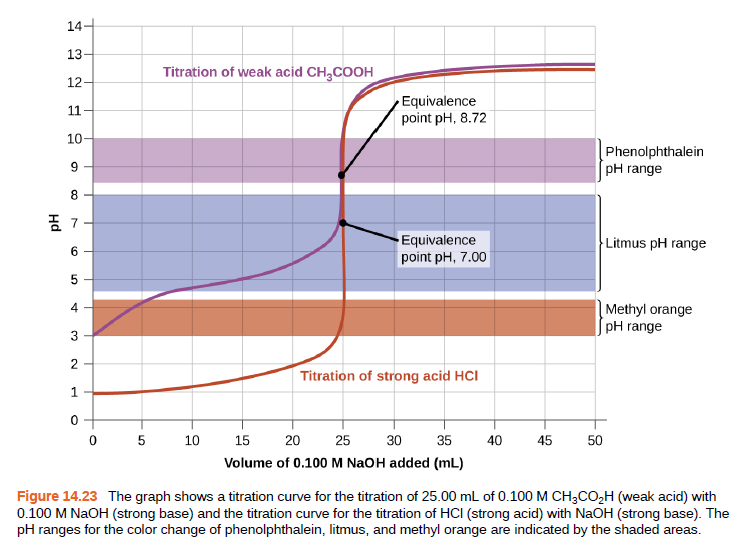
14- 13- Titration of weak acid CH,COOH 12 Equivalence point pH, 8.72 11 10 Phenolphthalein PH range 8 Equivalence point pH, 7.00 Litmus pH range 6 - Methyl orange [pH range 4 - 3 2 - Titration of strong acid HCI 0 5 10 15 20 25 30 35 40 45 50 Volume of 0.100 M NaOH added (mL) Figure 14.23 The graph shows a titration curve for the titration of 25.00 mL of 0.100 M CH3CO,H (weak acid) with 0.100 M NaOH (strong base) and the titration curve for the titration of HCI (strong acid) with NaOH (strong base). The pH ranges for the color change of phenolphthalein, litmus, and methyl orange are indicated by the shaded areas.


Ionic Equilibrium
Chemical equilibrium and ionic equilibrium are two major concepts in chemistry. Ionic equilibrium deals with the equilibrium involved in an ionization process while chemical equilibrium deals with the equilibrium during a chemical change. Ionic equilibrium is established between the ions and unionized species in a system. Understanding the concept of ionic equilibrium is very important to answer the questions related to certain chemical reactions in chemistry.
Arrhenius Acid
Arrhenius acid act as a good electrolyte as it dissociates to its respective ions in the aqueous solutions. Keeping it similar to the general acid properties, Arrhenius acid also neutralizes bases and turns litmus paper into red.
Bronsted Lowry Base In Inorganic Chemistry
Bronsted-Lowry base in inorganic chemistry is any chemical substance that can accept a proton from the other chemical substance it is reacting with.
Draw a curve similar to that as shown for a series of solutions of NH3. Plot [OH−] on the vertical axis and the total concentration of NH3 (both ionized and nonionized NH3 molecules) on the horizontal axis. Let the total concentration of NH3 vary from 1 × 10⁻¹⁰ M to 1 × 10⁻² M.


Trending now
This is a popular solution!

Step by step
Solved in 4 steps with 5 images


