14. A supply and demand puzzle The following graph shows the market for roses in 2009. Between 2009 and 2010, the equilibrium quantity of roses remained constant, but the equilibrium price of roses increased. From this, you can conclude that between 2009 and 2010, the supply of roses and the demand for roses Adjust the graph to illustrate your answer by showing the positions of the supply and demand curves in 2010. Note: Select and drag one or both of the curves to the desired position. Curves will snap into position, so if you try to move a curve and it snaps back to its original position, just drag it a little farther. Supply Demand Supply Demand QUANTITY (Roses) PRICE (Dollars per rose)
14. A supply and demand puzzle The following graph shows the market for roses in 2009. Between 2009 and 2010, the equilibrium quantity of roses remained constant, but the equilibrium price of roses increased. From this, you can conclude that between 2009 and 2010, the supply of roses and the demand for roses Adjust the graph to illustrate your answer by showing the positions of the supply and demand curves in 2010. Note: Select and drag one or both of the curves to the desired position. Curves will snap into position, so if you try to move a curve and it snaps back to its original position, just drag it a little farther. Supply Demand Supply Demand QUANTITY (Roses) PRICE (Dollars per rose)

Chapter5: Markets In Motion And Price Controls
Section: Chapter Questions
Problem 10P

Related questions
Question
Transcribed Image Text:14. A supply and demand puzzle
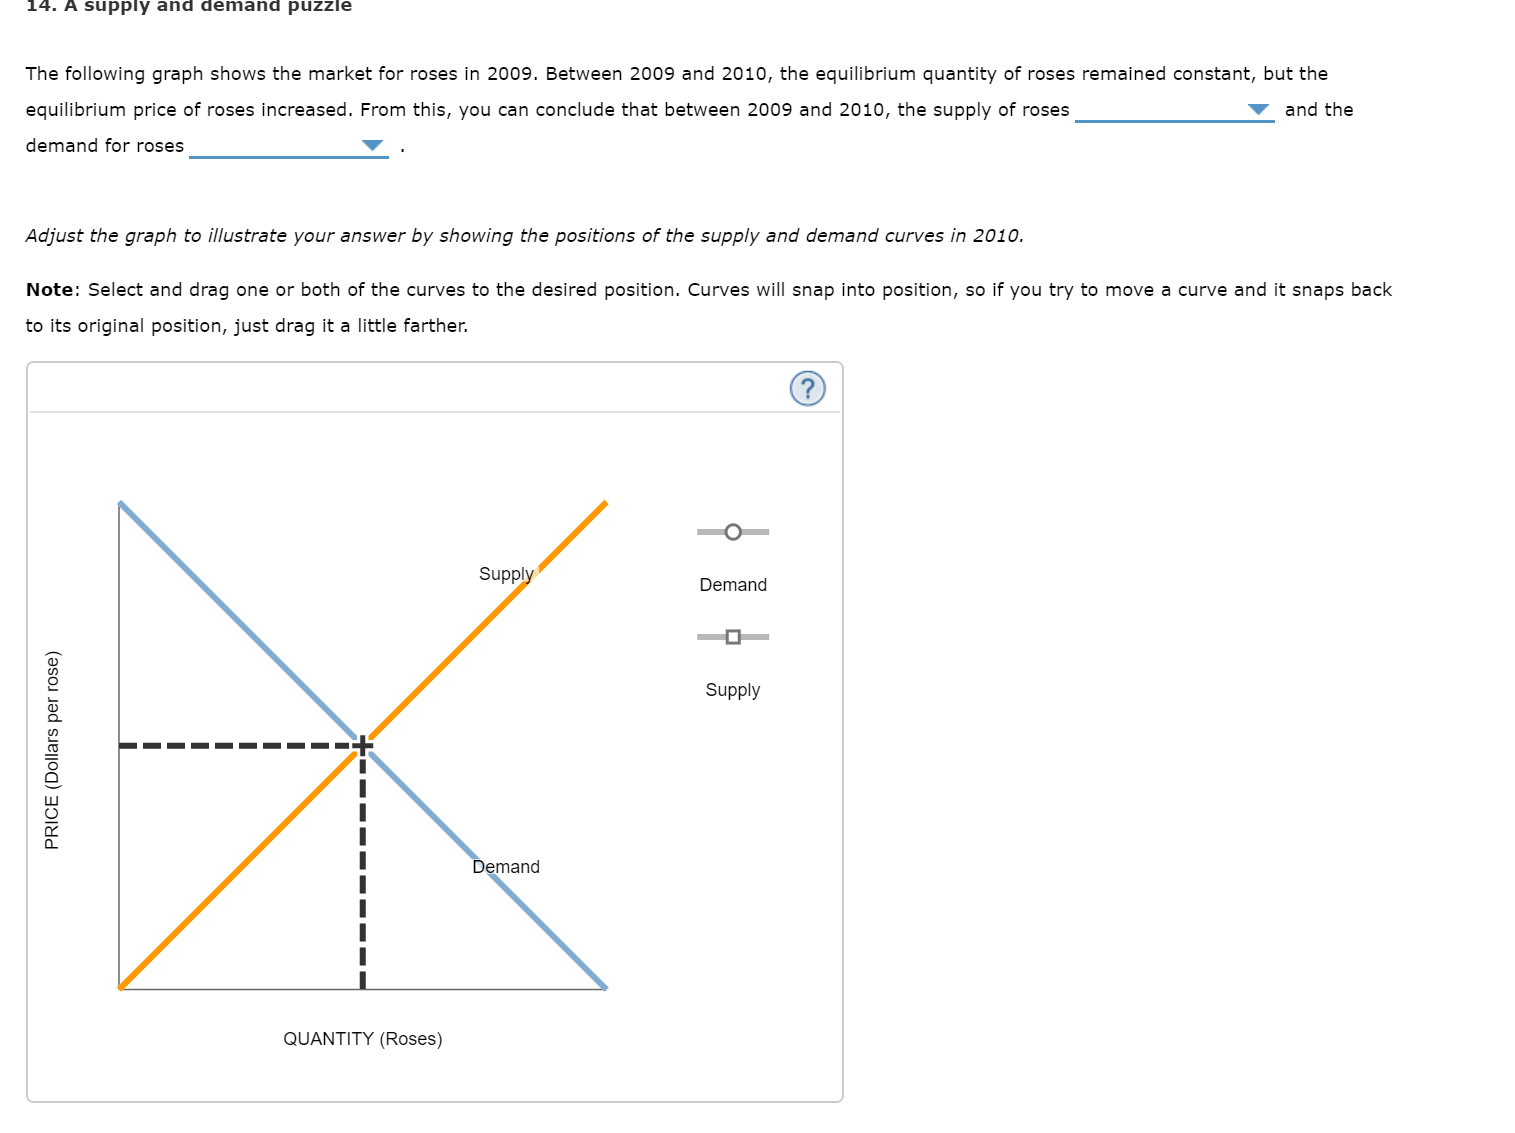
The following graph shows the market for roses in 2009. Between 2009 and 2010, the equilibrium quantity of roses remained constant, but the
equilibrium price of roses increased. From this, you can conclude that between 2009 and 2010, the supply of roses
and the
demand for roses
Adjust the graph to illustrate your answer by showing the positions of the supply and demand curves in 2010.
Note: Select and drag one or both of the curves to the desired position. Curves will snap into position, so if you try to move a curve and it snaps back
to its original position, just drag it a little farther.
Supply
Demand
Supply
Demand
QUANTITY (Roses)
PRICE (Dollars per rose)
Expert Solution
This question has been solved!
Explore an expertly crafted, step-by-step solution for a thorough understanding of key concepts.

This is a popular solution!

Trending now
This is a popular solution!

Step by step
Solved in 2 steps with 2 images

Recommended textbooks for you
Exploring Economics
Economics
ISBN:
9781544336329
Author:
Robert L. Sexton
Publisher:
SAGE Publications, Inc

Essentials of Economics (MindTap Course List)
Economics
ISBN:
9781337091992
Author:
N. Gregory Mankiw
Publisher:
Cengage Learning

Exploring Economics
Economics
ISBN:
9781544336329
Author:
Robert L. Sexton
Publisher:
SAGE Publications, Inc
Essentials of Economics (MindTap Course List)
Economics
ISBN:
9781337091992
Author:
N. Gregory Mankiw
Publisher:
Cengage Learning


Brief Principles of Macroeconomics (MindTap Cours…
Economics
ISBN:
9781337091985
Author:
N. Gregory Mankiw
Publisher:
Cengage Learning

Principles of Economics 2e
Economics
ISBN:
9781947172364
Author:
Steven A. Greenlaw; David Shapiro
Publisher:
OpenStax