下午1:55 4月21日周四 * 77%O 31. An experiment was conducted to investigate the relationship between the dose of a pain medication and the number of hours of pain relief. Twenty individuals with chronic pain were randomly assigned to one of five doses-0.0, 0.5, 1.0, 1.5, 2.0–in milligrams (mg) of medication. The results are shown in the scatterplot below. 14- 12- 10- 8. 6- 0.0 0.5 1.0 1.5 2.0 Dose (mg) The data were used to fit a least-squares regression line to predict the number of hours of pain relief for a given dose. Which of the following would be revealed by a plot of the residuals of the regression versus the dose? (A) The sum of the residuals is less than 0. (B) The sum of the residuals is greater than 0. (C) There are outliers associated with the lower doses. (D) The variation in the hours of pain relief is not the same across the doses. (E) There is a positive linear relationship between the residuals and the dose. Pain Relief (hours)
下午1:55 4月21日周四 * 77%O 31. An experiment was conducted to investigate the relationship between the dose of a pain medication and the number of hours of pain relief. Twenty individuals with chronic pain were randomly assigned to one of five doses-0.0, 0.5, 1.0, 1.5, 2.0–in milligrams (mg) of medication. The results are shown in the scatterplot below. 14- 12- 10- 8. 6- 0.0 0.5 1.0 1.5 2.0 Dose (mg) The data were used to fit a least-squares regression line to predict the number of hours of pain relief for a given dose. Which of the following would be revealed by a plot of the residuals of the regression versus the dose? (A) The sum of the residuals is less than 0. (B) The sum of the residuals is greater than 0. (C) There are outliers associated with the lower doses. (D) The variation in the hours of pain relief is not the same across the doses. (E) There is a positive linear relationship between the residuals and the dose. Pain Relief (hours)

Glencoe Algebra 1, Student Edition, 9780079039897, 0079039898, 2018
18th Edition
ISBN:9780079039897
Author:Carter
Publisher:Carter
Chapter4: Equations Of Linear Functions
Section4.5: Correlation And Causation
Problem 2CYU

Related questions
Question
Transcribed Image Text:下午1:55 4月21日周四
* 77%
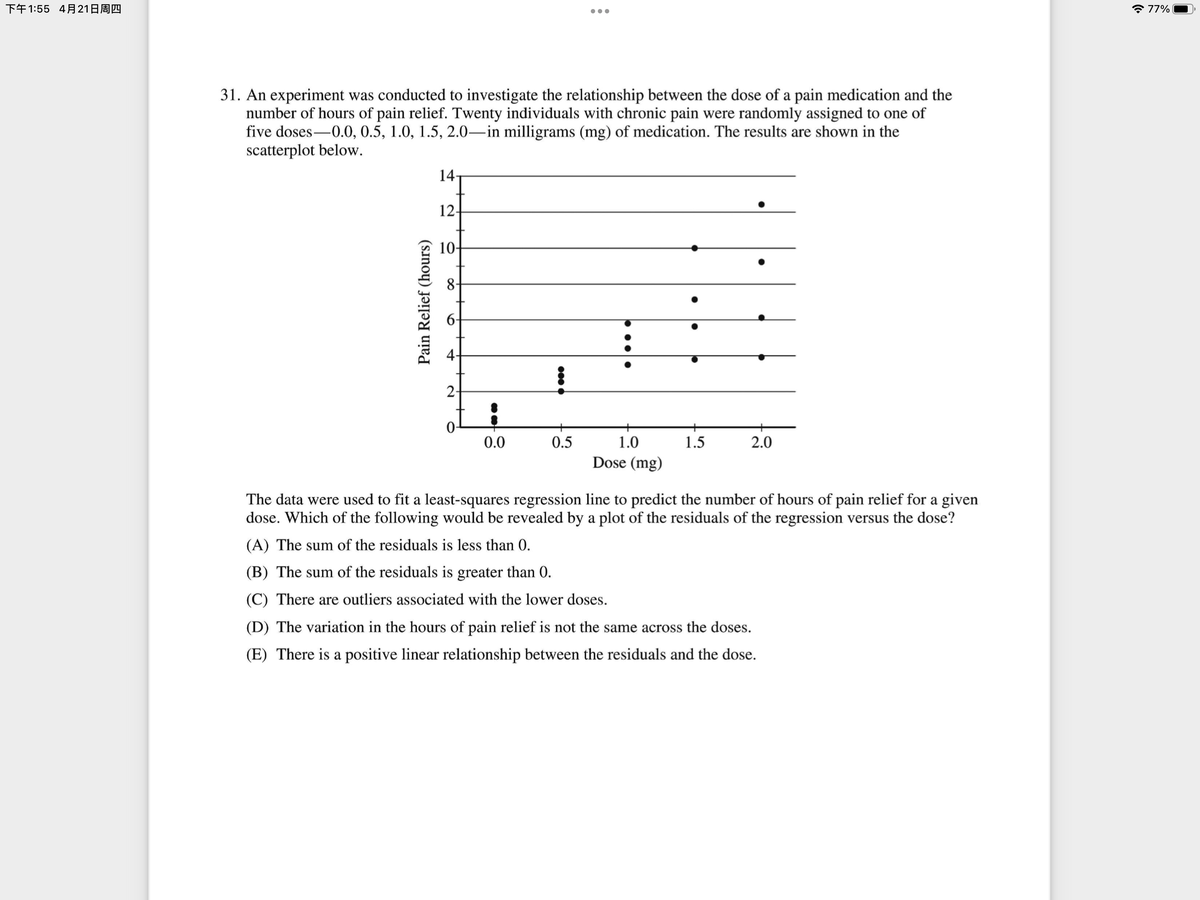
31. An experiment was conducted to investigate the relationship between the dose of a pain medication and the
number of hours of pain relief. Twenty individuals with chronic pain were randomly assigned to one of
five doses-0.0, 0.5, 1.0, 1.5, 2.0-in milligrams (mg) of medication. The results are shown in the
scatterplot below.
14-
12-
10-
2-
0.0
0.5
1.0
1.5
2.0
Dose (mg)
The data were used to fit a least-squares regression line to predict the number of hours of pain relief for a given
dose. Which of the following would be revealed by a plot of the residuals of the regression versus the dose?
(A) The sum of the residuals is less than 0.
(B) The sum of the residuals is greater than 0.
(C) There are outliers associated with the lower doses.
(D) The variation in the hours of pain relief is not the same across the doses.
(E) There is a positive linear relationship between the residuals and the dose.
••• •
6
4+
Pain Relief (hours)
Expert Solution
This question has been solved!
Explore an expertly crafted, step-by-step solution for a thorough understanding of key concepts.

This is a popular solution!

Trending now
This is a popular solution!

Step by step
Solved in 3 steps with 3 images

Recommended textbooks for you
Glencoe Algebra 1, Student Edition, 9780079039897…
Algebra
ISBN:
9780079039897
Author:
Carter
Publisher:
McGraw Hill
Glencoe Algebra 1, Student Edition, 9780079039897…
Algebra
ISBN:
9780079039897
Author:
Carter
Publisher:
McGraw Hill