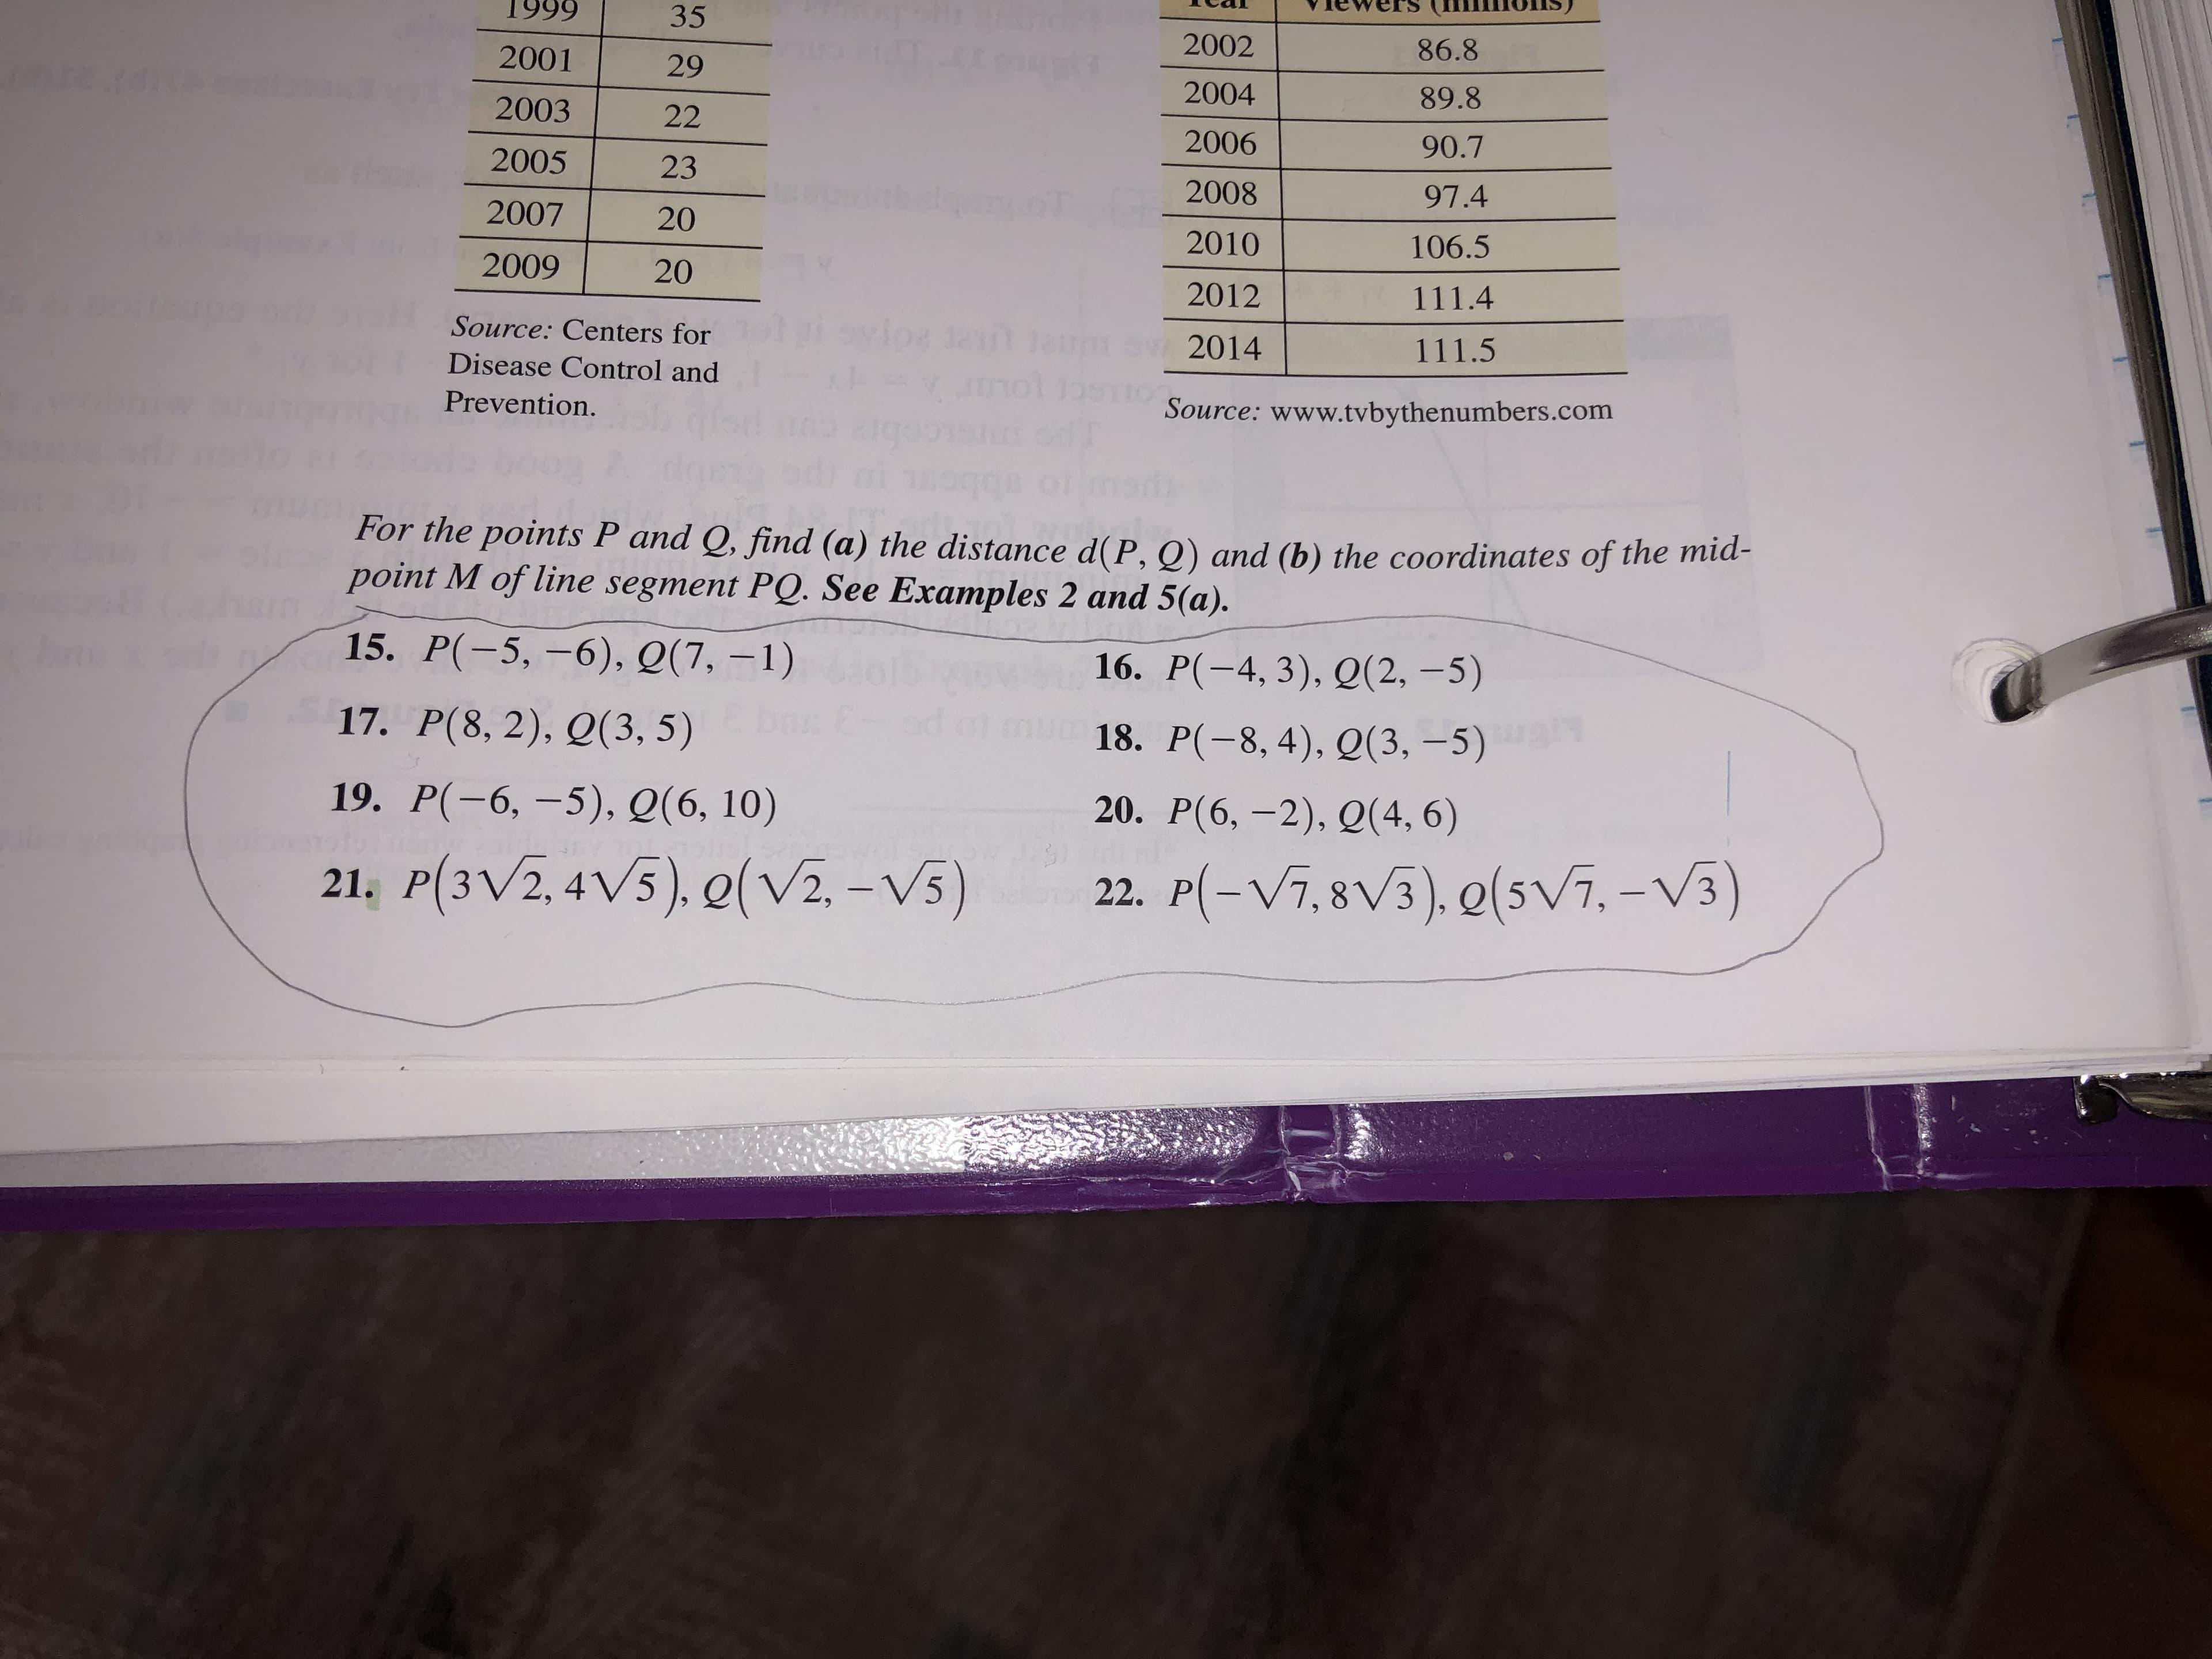
1999 35 2002 86.8 2001 29 2004 89.8 2003 22 2006 90.7 2005 23 2008 97.4 2007 20 2010 106.5 2009 20 2012 111.4 Svloe 12 1at Source: Centers for 111.5 2014 Disease Control and Source: www.tvbythenumbers.com Prevention. For the points P and Q, find (a) the distance d(P, Q) and (b) the coordinates of the mid- point M of line segment PQ. See Examples 2 and 5(a). 15. P(-5,-6), Q(7, -1) 16. P(-4, 3), Q(2,-5) 17. P(8, 2), Q(3, 5) 18. P(-8, 4), Q(3, -5) 20. P(6, -2), Q(4, 6) 19. P(-6, -5), Q(6, 10) P-Vi.8V3), o(si.-V3) P(3V2, 4V5), (V2, -V5) 22. 21.


Q: b) Fit a straight line to the following data. Also estimate the value of y at x =70. 71 68 | 73 | 69…
A: Given data's are as follows x 71 68 73 69 67 65 66 67 y(x) 69 72 70 70 68 67 68 64 To fit a…
Q: 1.Fit the best fitting straight line to the following data: A. Best fitting straight line? 3 4 6.…
A: The general linear equation is defined as y=a+bx. The linear regression technique uses a dataset to…
Q: Q.5 Fit a straight line of the best fit from the following data. Year Imports 2011 2012 2013 2014…
A: Q.5 The regression analysis is conducted using EXCEL. The software procedure is given below: Enter…
Q: a. Determine the slope (?1) and the y-intercept (?0). b. Formulate the estimated simple linear…
A: As per our guidelines , we are allowed to answer three sub-parts Given : The marketing manager of…
Q: Use the Midpoint Formula to estimate the sales of a certain company in 2005, given the sales in 2003…
A: NOTE: Refresh your page if you can't see any equations. . the given table is year sales (in…
Q: Alejandro is selling HDMI cables on eBay, and is trying to determine the best price to sell at. For…
A: Part a: It has been given that the line of best fit passes through the points (3.50, 280) and (4.75,…
Q: A chemical company, wishing to study the effect of extraction time on the efficiency of an…
A: Given Extraction time, minutes (x) Efficiency (y) 27 57 45 64 41 80 19 46 3 62 39 72…
Q: A driver records in the table her speed at various times during her journey. Time (min.) Speed (mph)…
A: Given that The scatter plot is created as Excel : data : insert : scatterplot The correct plot is…
Q: x0 2 3 5 6 у y 1 1 7 11 20
A: In my calculations the curve is y= a+bx+cx^2 , only change in coefficients. You can do it nomatter…
Q: A conservationist measures the diameters in centimeters of 100 oak trees in a forest. The data is…
A: Given Information: The five number summary of the data is: Minimum value = 3 First Quartile Q1=16.2…
Q: Find the shortest distance between the point A (3, 10) and the line y = x + 1.
A: Our Aim is to find the shortest distance between the point A(3,10) and the line y=12x+1 -(i)
Q: The data represent the heights in feet and the number of stories of the tallest buildings in a city.…
A: Given: n = 9 Formula Used: Correlation coefficient r = n∑XY-∑X∑Yn∑X2-∑X2n∑Y2-∑Y2 Test-statistic t =…
Q: A Daseball analyst would like to study various team statistics for a recent season to determine…
A: We need to use the concept of least squares to find regression coefficients , equation and its…
Q: Find the midpoint M of the line segment joining the points S (7, 4) and T = (-3, -2). %3D %3D
A:
Q: Find the best fitting straight line to the following data. 2 4 4 7 11 (i) 10 15 20 25 30 19 23 26 3.…
A: The equation of a straight line is defined using the linear equation: y=a+bx.The linear regression…
Q: Find the midpoint of points A(8, –7) and B(3, –1) graphically. Plot the line segment AB by clicking…
A: The graph is shown below:
Q: Below is a table of data that have been collected Price,p,($) Weekly Demand,s,(1,000s) 150 210 170…
A: Given Data: Price Weekly Demand 150 210 170 203 190 199 210 183 230 185 250 176…
Q: Determine the midpoint of the line segment between A and B shown below: 2 -3 -2 -1 1 2 3 -1 -2 - -3…
A: It can be observed that the point A is and the point B is . According to the Midpoint formula, the…
Q: B/Fit a straight line to the data given below. Also estimate the value of y at x-2.5. 3 4. 1.8 3.3…
A: Normal equations are as below : Given values :
Q: Alejandro is selling HDMI cables on eBay, and is trying to determine the best price to sell at. For…
A:
Q: Use the data from the table to create a scatter plot. Age (years) 3 3 2 5 4 5 7 6 8 6 Length (in.)…
A: EXCEL procedure to obtain the scatter plot: Go to EXCEL Go to Insert menu Select the range of the…
Q: In 1993, the average theatre ticket show price was P1400 and in 2001 the average price was P2800.…
A:
Q: 2. Find the best fitting straight line to the following data. (iii) 1 2 27 3 4 14 40 55 68 (iv) x 2…
A: Calculate Fitting a straight line - Curve fitting using Least square method
Q: Determine the equation of a straight line that fits to the data points (1, 4), (2, 6), (3, 9), (4,…
A: Given data points are : (1, 4), (2, 6), (3, 9), (4, 11), (5, 14), (6, 16). Let equation of a…
Q: a section of an English 201 class, the professor decides to be “generous” with the students and will…
A:
Q: The table shows the total number of trade apprenticeships in Canada each year from 1991 to 1997 a)…
A: (a) Plot the data on the cartesian plane using the Desmos.
Q: Q4. By plotting the graph of the given data mention whether there is a positive trend, negative…
A:
Q: The earnings per share for a social media company were $5.19 in 2017 and $7.53 in 2018. Use the…
A: Given: The earnings per share for a social media company were $5.19 in 2017 and $7.53 in 2018. To…
Q: Find the midpoint of points A(-9, 7) and B(1, 10) graphically. Plot the line segment AB by clicking…
A:
Q: (a) Draw tangent lines for 1982, 1990, 1995, and 2000. Estimate their slopes. Record the slopes.…
A: Draw the tangent lines for the years 1982, 1990, 1995, and 2000 as follows.
Q: 6. Plot the points on the coordinate plane 3 4 5. y 20 15 35 30 40 50 55 50
A: To find: (6). Plot the points on the coordinate plane. (7). Write the equation of the line of best…
Q: Hacettepe English (en) Find the coordinates of point C using the given data below. of stion Y A…
A:
Q: size (inches) 9 11 20 27 32 35 40 48 53 60 sale price (s) 147 186 197 297 447 1177 1228 1463…
A: Let us define the independent (X) and dependent (Y) first. Let , X be the size (in inches) that is…
Q: In Exercises 1-4, use the grid and a straight edge to make a rough estimate of the slope of the…
A: Given the graphs: To find: slope of curve at points P1 and P2
Q: The table projects t-shirt sales during an upcoming fundraiser (x) and the corresponding dollar…
A: We have given that the table projects t-shirt sales during an upcoming fundraiser (X) and the…
Q: Alejandro is selling HDMI cables on eBay, and is trying to determine the best price to sell at. For…
A: (a) Here, to find the equation of the line passing through the points (3.5,240) & (4.75,210)…
Q: Consider the following data Y 32 4 35 40 44 10 47 12 56 14 60 16 62 18 68 20 70 a. Make a scatter…
A: Linear Regression analysis is used to measure the association (or) linear relationship between two…
Q: Alejandro is selling HDMI cables on eBay, and is trying to determine the best price to se!! at. For…
A:
Q: The maximum discount value of the Entertainment® card for the “Fine Dining” section, Edition 10, for…
A: “Since you have posted a question with multiple sub-parts, we will solve first three sub-parts for…
Q: Q.5 Fit a straight line of the best fit from the following data. Year Imports 2011 | 2012 | 2013 |…
A: Therefore, using excel software fit a straight line of the given data by using following steps,…
Q: In Exercises 1-4, use the grid and a straight edge to make a rough estimate of the slope of the…
A: Part(3): It is given that each box in the graph having distance 0.2 unit. Let, ϕ be the angle made…
Q: . Find the best fitting straight line to the following data. (i) 1 4 4 3 11 (ii) 10 15 20 25 15 19…
A: Two data set are given. We need to find the best fitting straight line. The solution is given below.
Q: A chemical company, wishing to study the effect of extraction time on the efficiency of an…
A:
Q: Particulate Removed, Daily Rainfall, x (0.01 cm) 4.3 4.5 5.9 5.6 y (µg/m³) 126 121 116 118 6.1 114…
A:
Q: This scatter plot shows the relationship between temperature and total hot tea sales at a concession…
A: We are given with the graph and need to find y-intercept and slope of the graph.
Q: where bcan be positive or negative. 3,78 2.75 2.01 0.100 0.200 0.300 You wish to determine the value…
A: The function is in the form of y=aebx .................................... (1) The given table is,…
Q: The following graph shows the standard curve for a particular instrument. The of best fit is…
A: The graph of the particular instrument is given.
Q: A biscuit production manager wants to investigate the linear relationship between the number of…
A: (a) Determine the names of two most used popular correlation coefficients. The correct options are…
Q: Tind The E94ation of line which is normal to the lines X-2 = マー 3-2 %3D - and 2-X %3D 2. 3. 2.
A:
Q: Estimate and interpret the slope of this line 160 Gas bill (dollars) 140 120 100 80 60 40 20 Gas…
A: Given, The graph of straight line We have to find the slope of the line and interpret it.
Question 15, please.


Trending now
This is a popular solution!

Step by step
Solved in 4 steps with 4 images


- A candy manufacturer selects mints at random from the production line and weighs them. For one week, the day shift weighed n1 = 194 mints and the night shift weighed n2 = 162 mints. The numbers of these mints that weighed at most 21 grams was y1 = 28 for the day shift and y2 = 11 for the night shift. Let p1 and p2 denote the proportions of mints that weigh at most 21 grams for the day and night shifts, respectively. a) Give a point estimate for p1-p2 b) Find and interpret a 95% confidence interval for p1-p2 c) Can you claim a difference between difference between proportions of mints that weight at most 21g for the day and night shifts?According to the picture attached of the resdiual plot, pelase select the statement that is true. All the assumptions are met. There is problem of heteroscedasticity. There is problem of collinearity. We should include higher order terms.A machine to manufacture fasteners has a setup cost of $1,500 and a unit cost of $0.003 for each fastener manufactured. A newer machine has a setup cost of $1,750 but a unit cost of only $0.0025 for each fastener manufactured. Find the break point. (Round your answer to the nearest whole unit.)
- Find the point P on the line y=3x that is closest to the point (40,0). What is the least distance between P and (40,0)?A college bookstore must order books two months before each semester starts. They believe that the number of books that will ultimately be sold for any particular course is related to the number of students registered for the course when the books are ordered. They would like to develop a bestfitting line to predict how many books to order. From past records, the bookstore obtains the number of students registered, X, and the number of books actually sold for a course, Y , for 12 different semesters.A scatterplot of the data along with the best fitting line is presented below. a. The correlation between the two variables is r = .89. Calculate and interpret the value of r2.b. The equation for the best fitting line is Y = 9.30 + 0.673X. Explain and interpret the value of 9.30.c. How many books should the store order for a class of 50 students? Would you trust this prediction?A neuroscientist hypothesizes that she found the region in the rat brain responsible for the motion of the right paw. She trains 20 right-handed rats in a specific task to push a lever to to receive a tasty pellet of food. After the all the rats learn the behavior, she randomly selects 10 of them a does a surgery to place an implant on the brains of rats through which a lazer can deactivate the said region in the brain. After the rats heal, she runs all the rats through the same task. While 10 of them went through the experiment unbothered, the other 10 who had the implant were stimulated by a lazer through their implants to disrupt the functioning of the hypothesized critical region. The neuroscientist collected the amount of rewards(number of food pellets received)the rats in both groups were able to collect:Xsurgery: 2, 4, 3, 1, 5, 3, 4, 1, 3, 4Xcontrol: 5, 6, 4, 6, 8, 9, 2, 5, 6, 3 d. Calculate 95% confidence intervals for the estimate of the difference.
- A neuroscientist hypothesizes that she found the region in the rat brain responsible for the motion of the right paw. She trains 20 right-handed rats in a specific task to push a lever to to receive a tasty pellet of food. After the all the rats learn the behavior, she randomly selects 10 of them a does a surgery to place an implant on the brains of rats through which a lazer can deactivate the said region in the brain. After the rats heal, she runs all the rats through the same task. While 10 of them went through the experiment unbothered, the other 10 who had the implant were stimulated by a lazer through their implants to disrupt the functioning of the hypothesized critical region. The neuroscientist collected the amount of rewards(number of food pellets received)the rats in both groups were able to collect:Xsurgery: 2, 4, 3, 1, 5, 3, 4, 1, 3, 4Xcontrol: 5, 6, 4, 6, 8, 9, 2, 5, 6, 3 c. Conduct the test. Make a decision about the null hypothesis, interpret your results and…A neuroscientist hypothesizes that she found the region in the rat brain responsible for the motion of the right paw. She trains 20 right-handed rats in a specific task to push a lever to to receive a tasty pellet of food. After the all the rats learn the behavior, she randomly selects 10 of them a does a surgery to place an implant on the brains of rats through which a lazer can deactivate the said region in the brain. After the rats heal, she runs all the rats through the same task. While 10 of them went through the experiment unbothered, the other 10 who had the implant were stimulated by a lazer through their implants to disrupt the functioning of the hypothesized critical region. The neuroscientist collected the amount of rewards(number of food pellets received)the rats in both groups were able to collect:Xsurgery: 2, 4, 3, 1, 5, 3, 4, 1, 3, 4Xcontrol: 5, 6, 4, 6, 8, 9, 2, 5, 6, 3 A. Name the appropriate statistical procedure to apply. B. Identify the predictor and predicted…The cashier line of a canteen can facilitate up to 60 customers an hour. Frequenters of thecanteen arrive at an average of 50 an hour. Suppose that management wants toevaluate the desirability of opening a second order-processing station so that twocustomers can be served simultaneously. Assume a single waiting line with the firstcustomer in line moving to the first available server.a. What is the average arrival time in minutes of customers?b. What is the average service time in minutes of the canteen?c. What is the probability that the canteen has a customer?d. What is the probability that the canteen does not have any customer?e. How long would the line be on average (average number of customers in thesystem)?f. How many people are waiting to be served on average?g. How long in minutes would it take the customer from lining up until he leaves thewaiting line?h. How long in minutes would a customer wait to be served on average?i. Find the probability that there are 7 customers in the…
- An explosion at a construction site could haveoccurred as the result of static electricity, malfunctioningof equipment, carelessness, or sabotage. Interviews withconstruction engineers analyzing the risks involved ledto the estimates that such an explosion would occur withprobability 0.25 as a result of static electricity, 0.20 as aresult of malfunctioning of equipment, 0.40 as a result ofcarelessness, and 0.75 as a result of sabotage. It is alsofelt that the prior probabilities of the four causes of theexplosion are 0.20, 0.40, 0.25, and 0.15. Based on all thisinformation, what is(a) the most likely cause of the explosion;(b) the least likely cause of the explosion?The following chart shows monthly figures for Apple stock in 2010.† The graph contains a series of 12 points connected by curves. The curves and the approximate points they connect are as follows. The curves start at (Jan-10, 211.98), go down and right to (Feb-10, 195.46), go up and right to (Mar-10, 218.95), go up and right to (Apr-10, 235.97), go down and right to (May-10, 235.86), go up and right to (Jun-10, 255.96), go down and right to (Jul-10, 246.94), go up and right to (Aug-10, 260.09), go down and right to (Sep-10, 258.77), go up and right to (Oct-10, 294.07), go up and right to (Nov-10, 317.13), and go up and right to stop at (Dec-10, 317.44). Marked are the following points on the chart. Jan. 10 Feb. 10 Mar. 10 Apr. 10 May 10 June 10 211.98 195.46 218.95 235.97 235.86 255.96 July 10 Aug. 10 Sep. 10 Oct. 10 Nov. 10 Dec. 10 246.94 260.09 258.77 294.07 317.13 317.44 Calculate to the nearest 0.01% your monthly percentage return (on a simple interest basis) if you…The following chart shows monthly figures for Apple stock in 2010.† The graph contains a series of 12 points connected by curves. The curves and the approximate points they connect are as follows. The curves start at (Jan-10, 211.98), go down and right to (Feb-10, 195.46), go up and right to (Mar-10, 218.95), go up and right to (Apr-10, 235.97), go down and right to (May-10, 235.86), go up and right to (Jun-10, 255.96), go down and right to (Jul-10, 246.94), go up and right to (Aug-10, 260.09), go down and right to (Sep-10, 258.77), go up and right to (Oct-10, 294.07), go up and right to (Nov-10, 317.13), and go up and right to stop at (Dec-10, 317.44). Marked are the following points on the chart. Jan. 10 Feb. 10 Mar. 10 Apr. 10 May 10 June 10 211.98 195.46 218.95 235.97 235.86 255.96 July 10 Aug. 10 Sep. 10 Oct. 10 Nov. 10 Dec. 10 246.94 260.09 258.77 294.07 317.13 317.44 Suppose you bought Apple stock in May. If you later sold at one of the marked dates on the chart,…