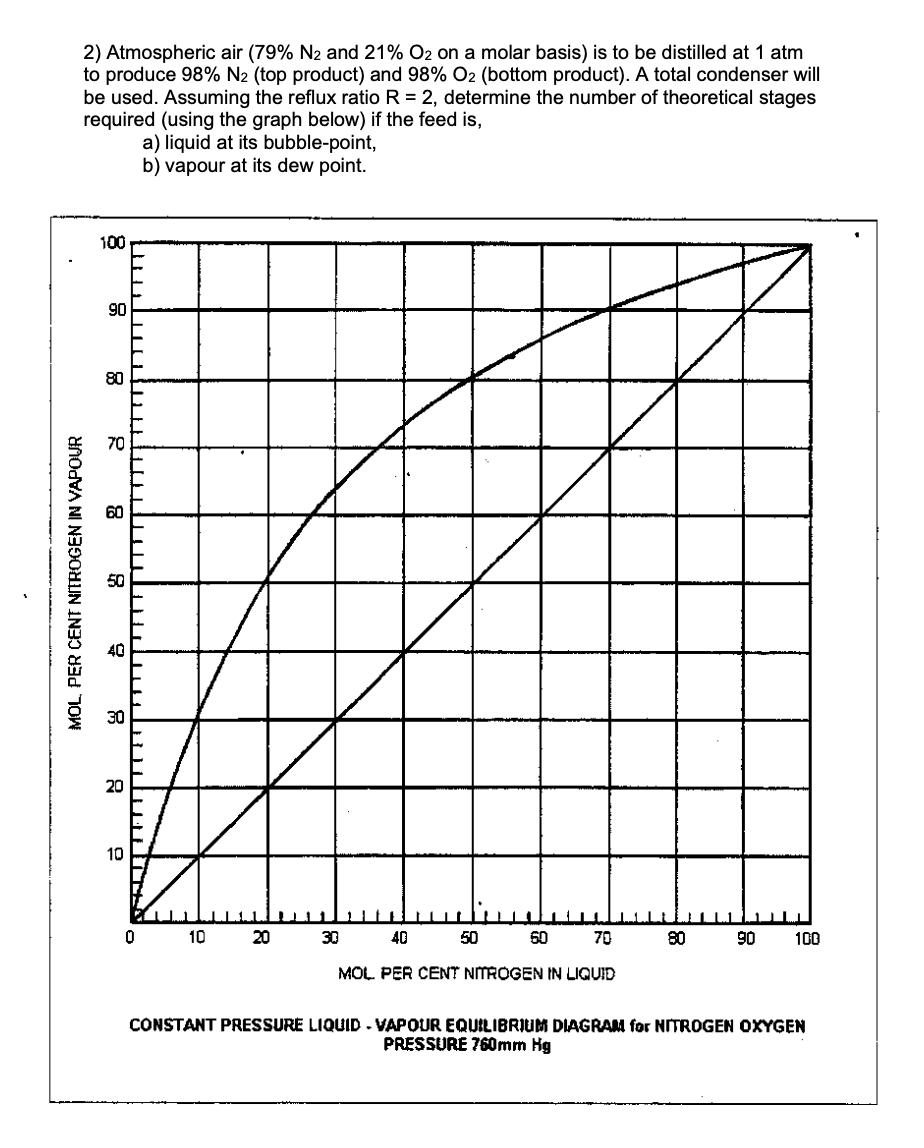
2) Atmospheric air (79% N₂ and 21% O2 on a molar basis) is to be distilled at 1 atm to produce 98% N2 (top product) and 98% O2 (bottom product). A total condenser will be used. Assuming the reflux ratio R = 2, determine the number of theoretical stages required (using the graph below) if the feed is, a) liquid at its bubble-point, b) vapour at its dew point. 100 90 80 70 8 MOL, PER CENT NITROGEN IN VAPOUR 20 10 10 20 30 40 MOL PER CENT NITROGEN IN LIQUID 50 60 70 80 90 100
2) Atmospheric air (79% N₂ and 21% O2 on a molar basis) is to be distilled at 1 atm to produce 98% N2 (top product) and 98% O2 (bottom product). A total condenser will be used. Assuming the reflux ratio R = 2, determine the number of theoretical stages required (using the graph below) if the feed is, a) liquid at its bubble-point, b) vapour at its dew point. 100 90 80 70 8 MOL, PER CENT NITROGEN IN VAPOUR 20 10 10 20 30 40 MOL PER CENT NITROGEN IN LIQUID 50 60 70 80 90 100

Introduction to Chemical Engineering Thermodynamics
8th Edition
ISBN:9781259696527
Author:J.M. Smith Termodinamica en ingenieria quimica, Hendrick C Van Ness, Michael Abbott, Mark Swihart
Publisher:J.M. Smith Termodinamica en ingenieria quimica, Hendrick C Van Ness, Michael Abbott, Mark Swihart
Chapter1: Introduction
Section: Chapter Questions
Problem 1.1P

Related questions
Question
ans Q2a): 6 theoretical plates plus the reboiler; feed on stage 4 b) 6 or 7 theoretical plates plus reboiler - depends on how you draw the diagram; feed on stage 4 or 5
feedback attached to help with ques
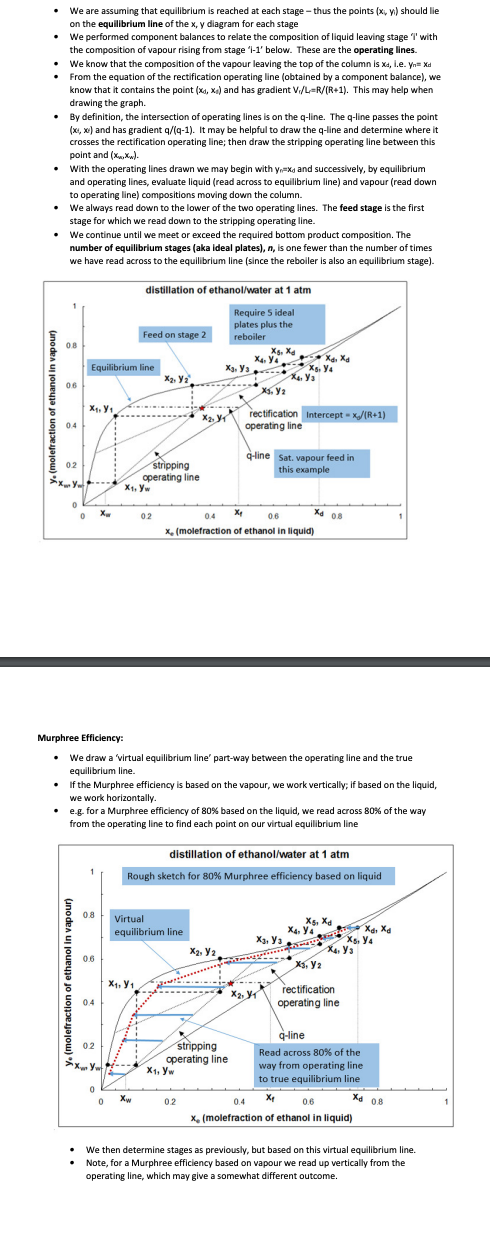
Transcribed Image Text:We are assuming that equilibrium is reached at each stage - thus the points (x, y) should lie
on the equilibrium line of the x, y diagram for each stage
We performed component balances to relate the composition of liquid leaving stage 'I' with
the composition of vapour rising from stage 'i-1' below. These are the operating lines
We know that the composition of the vapour leaving the top of the column is xa, i.e. Yn= Xd
From the equation of the rectification operating line (obtained by a component balance), we
know that it contains the point (x, x₁) and has gradient V₁/L-R/(R+1). This may help when
drawing the graph.
By definition, the intersection of operating lines is on the q-line. The q-line passes the point
(x,x) and has gradient q/(q-1). It may be helpful to draw the q-line and determine where it
crosses the rectification operating line; then draw the stripping operating line between this
point and (XX).
With the operating lines drawn we may begin with y₁x and successively, by equilibrium
and operating lines, evaluate liquid (read across to equilibrium line) and vapour (read down
to operating line) compositions moving down the column.
We always read down to the lower of the two operating lines. The feed stage is the first
stage for which we read down to the stripping operating line.
We continue until we meet or exceed the required bottom product composition. The
number of equilibrium stages (aka ideal plates), n, is one fewer than the number of times
we have read across to the equilibrium line (since the reboiler is also an equilibrium stage).
0.8
0.6
0.4
0.2
=x-Y
0
0
X₁,Y₁
.
Equilibrium line
0.8
Xa
0.6
04
02
*XmYw
distillation of ethanol/water at 1 atm
Require 5 ideal
plates plus the
reboiler
0
Feed on stage 2
X₁, Yw
stripping
operating line
X₁, Y₁
X2, Y2
0.2
Xw
Murphree Efficiency:
We draw a 'virtual equilibrium line' part-way between the operating line and the true
equilibrium line.
If the Murphree efficiency is based on the vapour, we work vertically; if based on the liquid,
we work horizontally.
• e.g. for a Murphree efficiency of 80% based on the liquid, we read across 80% of the way
from the operating line to find each point on our virtual equilibrium line
Virtual
equilibrium line
X₂X₁
0.4
X₁
0.6
x, (molefraction of ethanol in liquid)
X5, Xd
X3. Y3X₁Y3
Уз
X₁,Y₂
X2, Y2
*******
to X
Xs. Y4
distillation of ethanol/water at 1 atm
Rough sketch for 80% Murphree efficiency based on liquid
X1, Yw
0.2
rectification Intercept -x/(R+1)
operating line
..
stripping
operating line
q-line Sat. vapour feed in
this example
Xa 08
X₂, X₁
X5, Xd
X4, Y4
X3, 3X5. Y4
X3, Y2
rectification
operating line
Xd, Xd
q-line
Read across 80% of the
way from operating line.
to true equilibrium line
0.4
X₁ 0.6
x, (molefraction of ethanol in liquid)
Xd 0.8
We then determine stages as previously, but based on this virtual equilibrium line.
Note, for a Murphree efficiency based on vapour we read up vertically from the
operating line, which may give a somewhat different outcome.
Transcribed Image Text:2) Atmospheric air (79% N₂ and 21% O₂ on a molar basis) is to be distilled at 1 atm
to produce 98% N2 (top product) and 98% O2 (bottom product). A total condenser will
be used. Assuming the reflux ratio R = 2, determine the number of theoretical stages
required (using the graph below) if the feed is,
a) liquid at its bubble-point,
b) vapour at its dew point.
MOL PER CENT NITROGEN IN VAPOUR
100
90
80
70
60
40
30
20
10
MU
0
10
20
30
40
70
MOL PER CENT NITROGEN IN LIQUID
50
60
80
90
100
CONSTANT PRESSURE LIQUID - VAPOUR EQUILIBRIUM DIAGRAM for NITROGEN OXYGEN
PRESSURE 760mm Hg
Expert Solution
This question has been solved!
Explore an expertly crafted, step-by-step solution for a thorough understanding of key concepts.

Step by step
Solved in 3 steps with 3 images

Recommended textbooks for you
Introduction to Chemical Engineering Thermodynami…
Chemical Engineering
ISBN:
9781259696527
Author:
J.M. Smith Termodinamica en ingenieria quimica, Hendrick C Van Ness, Michael Abbott, Mark Swihart
Publisher:
McGraw-Hill Education

Elementary Principles of Chemical Processes, Bind…
Chemical Engineering
ISBN:
9781118431221
Author:
Richard M. Felder, Ronald W. Rousseau, Lisa G. Bullard
Publisher:
WILEY

Elements of Chemical Reaction Engineering (5th Ed…
Chemical Engineering
ISBN:
9780133887518
Author:
H. Scott Fogler
Publisher:
Prentice Hall
Introduction to Chemical Engineering Thermodynami…
Chemical Engineering
ISBN:
9781259696527
Author:
J.M. Smith Termodinamica en ingenieria quimica, Hendrick C Van Ness, Michael Abbott, Mark Swihart
Publisher:
McGraw-Hill Education
Elementary Principles of Chemical Processes, Bind…
Chemical Engineering
ISBN:
9781118431221
Author:
Richard M. Felder, Ronald W. Rousseau, Lisa G. Bullard
Publisher:
WILEY
Elements of Chemical Reaction Engineering (5th Ed…
Chemical Engineering
ISBN:
9780133887518
Author:
H. Scott Fogler
Publisher:
Prentice Hall


Industrial Plastics: Theory and Applications
Chemical Engineering
ISBN:
9781285061238
Author:
Lokensgard, Erik
Publisher:
Delmar Cengage Learning

Unit Operations of Chemical Engineering
Chemical Engineering
ISBN:
9780072848236
Author:
Warren McCabe, Julian C. Smith, Peter Harriott
Publisher:
McGraw-Hill Companies, The