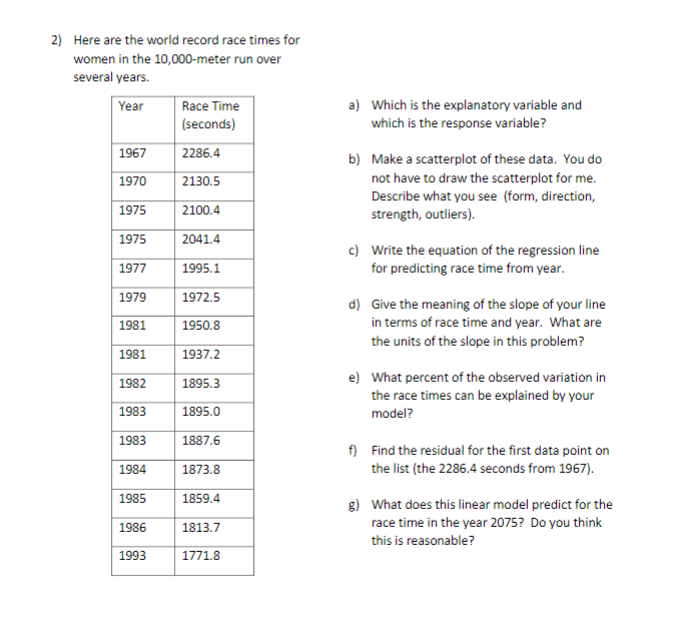
2) Here are the world record race times for women in the 10,000-meter run over several years. Race Time (seconds) Year a) Which is the explanatory variable and which is the response variable? 1967 2286.4 b) Make a scatterplot of these data. You do | 2130.5 not have to draw the scatterplot for me. Describe what you see (form, direction, 1970 1975 2100.4 strength, outliers). 1975 2041.4 c) Write the equation of the regression line for predicting race time from year. 1977 1995.1 1979 1972.5 d) Give the meaning of the slope of your line in terms of race time and year. What are the units of the slope in this problem? 1981 1950.8 1981 1937.2 e) What percent of the observed variation in the race times can be explained by your 1982 1895.3 1983 1895.0 model? 1983 1887.6 f) Find the residual for the first data point on the list (the 2286.4 seconds from 1967). 1984 1873.8 1985 1859.4 g) What does this linear model predict for the race time in the year 2075? Do you think this is reasonable? 1986 1813.7 1993 1771.8
2) Here are the world record race times for women in the 10,000-meter run over several years. Race Time (seconds) Year a) Which is the explanatory variable and which is the response variable? 1967 2286.4 b) Make a scatterplot of these data. You do | 2130.5 not have to draw the scatterplot for me. Describe what you see (form, direction, 1970 1975 2100.4 strength, outliers). 1975 2041.4 c) Write the equation of the regression line for predicting race time from year. 1977 1995.1 1979 1972.5 d) Give the meaning of the slope of your line in terms of race time and year. What are the units of the slope in this problem? 1981 1950.8 1981 1937.2 e) What percent of the observed variation in the race times can be explained by your 1982 1895.3 1983 1895.0 model? 1983 1887.6 f) Find the residual for the first data point on the list (the 2286.4 seconds from 1967). 1984 1873.8 1985 1859.4 g) What does this linear model predict for the race time in the year 2075? Do you think this is reasonable? 1986 1813.7 1993 1771.8

Algebra & Trigonometry with Analytic Geometry
13th Edition
ISBN:9781133382119
Author:Swokowski
Publisher:Swokowski
Chapter7: Analytic Trigonometry
Section7.6: The Inverse Trigonometric Functions
Problem 91E

Related questions

Question
Answer D E F
Transcribed Image Text:2) Here are the world record race times for
women in the 10,000-meter run over
several years.
Race Time
(seconds)
Year
a) Which is the explanatory variable and
which is the response variable?
1967
2286.4
b) Make a scatterplot of these data. You do
| 2130.5
not have to draw the scatterplot for me.
Describe what you see (form, direction,
1970
1975
2100.4
strength, outliers).
1975
2041.4
c) Write the equation of the regression line
for predicting race time from year.
1977
1995.1
1979
1972.5
d) Give the meaning of the slope of your line
in terms of race time and year. What are
the units of the slope in this problem?
1981
1950.8
1981
1937.2
e) What percent of the observed variation in
the race times can be explained by your
1982
1895.3
1983
1895.0
model?
1983
1887.6
f) Find the residual for the first data point on
the list (the 2286.4 seconds from 1967).
1984
1873.8
1985
1859.4
g) What does this linear model predict for the
race time in the year 2075? Do you think
this is reasonable?
1986
1813.7
1993
1771.8
Expert Solution
This question has been solved!
Explore an expertly crafted, step-by-step solution for a thorough understanding of key concepts.

Step by step
Solved in 3 steps with 2 images

Knowledge Booster


Learn more about
Need a deep-dive on the concept behind this application? Look no further. Learn more about this topic, statistics and related others by exploring similar questions and additional content below.Recommended textbooks for you
Algebra & Trigonometry with Analytic Geometry
Algebra
ISBN:
9781133382119
Author:
Swokowski
Publisher:
Cengage

Glencoe Algebra 1, Student Edition, 9780079039897…
Algebra
ISBN:
9780079039897
Author:
Carter
Publisher:
McGraw Hill
Algebra & Trigonometry with Analytic Geometry
Algebra
ISBN:
9781133382119
Author:
Swokowski
Publisher:
Cengage
Glencoe Algebra 1, Student Edition, 9780079039897…
Algebra
ISBN:
9780079039897
Author:
Carter
Publisher:
McGraw Hill