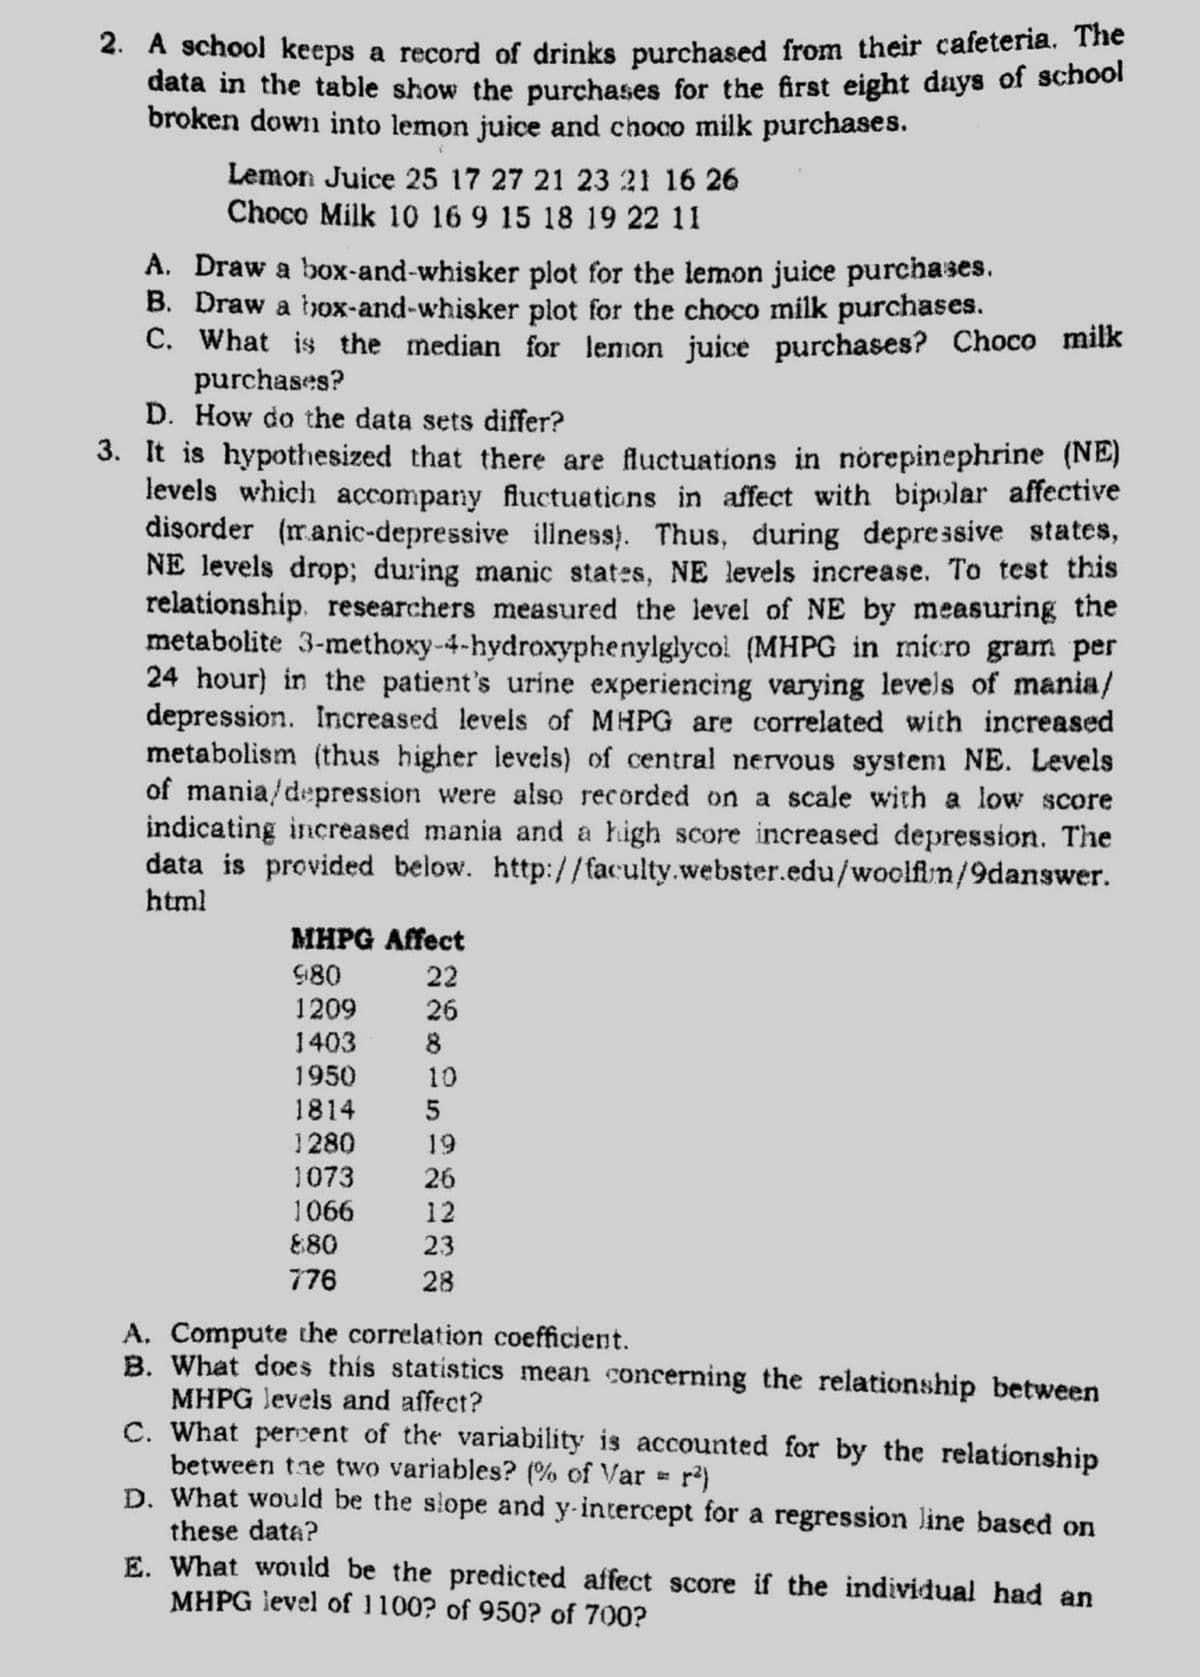
2. A school keeps a record of drinks purchased from their cafeteria. The data in the table show the purchases for the first eight days of school broken down into lemon juice and choco milk purchases. Lemon Juice 25 17 27 21 23 21 16 26 Choco Milk 10 16 9 15 18 19 22 11 A. Draw a box-and-whisker plot for the lemon juice purchases. B. Draw a hox-and-whisker plot for the choco milk purchases. C. What is the median for lemon juice purchases? Choco milk purchases? D. How do the data sets differ?

Glencoe Algebra 1, Student Edition, 9780079039897, 0079039898, 2018
18th Edition
ISBN:9780079039897
Author:Carter
Publisher:Carter
Chapter10: Statistics
Section10.4: Distributions Of Data
Problem 20PFA
icon
Related questions
icon
Concept explainers
Topic Video
Question
2. A school keeps a record of drinks purchased from their cafeteria. The
data in the table show the purchases for the first eight days of school
broken down into lemon juice and choco milk purchases.
Lemon Juice 25 17 27 21 23 21 16 26
Choco Milk 10 16 9 15 18 19 22 11
A. Draw a box-and-whisker plot for the lemon juice purchases.
B. Draw a hox-and-whisker plot for the choco milk purchases.
C. What is the median for lemon juice purchases? Choco milk
purchases?
D. How do the data sets differ?
3. It is hypothesized that there are fluctuations in norepinephrine (NE)
levels which accompany fluctuations in affect with bipolar affective
disorder (manic-depressive illness). Thus, during depressive states,
NE levels drop; during manic states, NE levels increase. To test this
relationship. researchers measured the level of NE by measuring the
metabolite 3-methoxy-4-hydroxyphenylglycol (MHPG in micro gram per
24 hour) in the patient's urine experiencing varying levels of mania/
depression. Increased levels of MHPG are correlated with increased
metabolism (thus higher levels) of central nervous systen NE. Levels
of mania/depression were also recorded on a scale with a low score
indicating increased mania and a high score increased depression. The
data is provided below. http://faculty.webster.edu/woolfln/9danswer.
html
MHPG Affect
980
22
1209
26
1403
8.
1950
10
1814 5
1280
19
1073
26
1066
12
E80
23
776
28
A. Compute the correlation coefficient.
B. What does this statistics mean concerning the relationship between
MHPG levels and affect?
c. What perent of the variability is accounted for by the relationship
between tne two variables? (% of Var = r}
D. What would be the slope and y-intercept for a regression line based on
these data?
E. What woıld be the predicted affect score if the individual had an
MHPG level of 1100? of 950? of 700?
Transcribed Image Text:2. A school keeps a record of drinks purchased from their cafeteria. The data in the table show the purchases for the first eight days of school broken down into lemon juice and choco milk purchases. Lemon Juice 25 17 27 21 23 21 16 26 Choco Milk 10 16 9 15 18 19 22 11 A. Draw a box-and-whisker plot for the lemon juice purchases. B. Draw a hox-and-whisker plot for the choco milk purchases. C. What is the median for lemon juice purchases? Choco milk purchases? D. How do the data sets differ? 3. It is hypothesized that there are fluctuations in norepinephrine (NE) levels which accompany fluctuations in affect with bipolar affective disorder (manic-depressive illness). Thus, during depressive states, NE levels drop; during manic states, NE levels increase. To test this relationship. researchers measured the level of NE by measuring the metabolite 3-methoxy-4-hydroxyphenylglycol (MHPG in micro gram per 24 hour) in the patient's urine experiencing varying levels of mania/ depression. Increased levels of MHPG are correlated with increased metabolism (thus higher levels) of central nervous systen NE. Levels of mania/depression were also recorded on a scale with a low score indicating increased mania and a high score increased depression. The data is provided below. http://faculty.webster.edu/woolfln/9danswer. html MHPG Affect 980 22 1209 26 1403 8. 1950 10 1814 5 1280 19 1073 26 1066 12 E80 23 776 28 A. Compute the correlation coefficient. B. What does this statistics mean concerning the relationship between MHPG levels and affect? c. What perent of the variability is accounted for by the relationship between tne two variables? (% of Var = r} D. What would be the slope and y-intercept for a regression line based on these data? E. What woıld be the predicted affect score if the individual had an MHPG level of 1100? of 950? of 700?
Expert Solution
trending now

Trending now

This is a popular solution!

steps

Step by step

Solved in 3 steps with 2 images

Blurred answer
Knowledge Booster
Centre, Spread, and Shape of a Distribution
Learn more about
Need a deep-dive on the concept behind this application? Look no further. Learn more about this topic, statistics and related others by exploring similar questions and additional content below.
Recommended textbooks for you
Glencoe Algebra 1, Student Edition, 9780079039897…
Algebra
ISBN:
9780079039897
Author:
Carter
Publisher:
McGraw Hill
Holt Mcdougal Larson Pre-algebra: Student Edition…
Algebra
ISBN:
9780547587776
Author:
HOLT MCDOUGAL
Publisher:
HOLT MCDOUGAL
Functions and Change: A Modeling Approach to Coll…
Algebra
ISBN:
9781337111348
Author:
Bruce Crauder, Benny Evans, Alan Noell
Publisher:
Cengage Learning