2. For the same houses from Question 1, a multiple regression model is now used to predict the price y (in $1000) of the n = 28 Seatle home prices based on two more explanatory variables in addition to square feet. The explanatory variables are then X1 = square feet ; Price/Square Feet; Bathrooms (Number of bathrooms). B1, B2 and B3 are the corresponding parameters in the model. For all the testing problem hereby, set significance level a = 0.05. Response Price ($000) Summary of Fit RSquare RSquare Adj Root Mean Square Error Mean of Response Observations (or Sum Wgts) 0.9534 0.947575 29.38132 Response Price ($000) Summary of Fit 356.8214 28 RSquare RSquare Adj Root Mean Square Error Mean of Response Observations (or Sum Wgts) 0.131114 0.097695 v Analysis of Variance 121.8935 Sum of 356.8214 Source DF Squares Mean Square F Ratio 28 Model 423883.82 141295 163.6752 Analysis of Variance Error 24 20718.29 863 Prob > F C. Total 27 444602.11 <.0001* Sum of Source DF Squares Mean Square F Ratio v Parameter Estimates Model 58293.36 58293.4 3.9234 Term Estimate Std Error t Ratio Prob>|t| 14858.0 Prob > F 0.0583 Error 26 386308.75 C. Total Intercept Square Feet 0.1895693 0.011048 Price/Sq Ft -371.4508 45.67288 -8.13 <.0001* 27 444602.11 17.16 <.0001* v Parameter Estimates 12.51 <.0001* -0.33 0.7411 1961.0355 156.728 Bathrooms -3.798639 11.36416 Term Estimate Std Error t Ratio Prob>|t| Intercept Price/Sq Ft 1089.7999 550.1965 v Effect Tests 149.87283 106.9894 1.40 0.1731 1.98 0.0583 Sum of Nparm F Ratio Prob > F Effect Tests Source DF Squares Square Feet Price/Sq Ft Bathrooms 254169.70 294.4294 <.0001* Sum of 135151.41 156.5590 <.0001* Source Nparm DF Squares F Ratio Prob > F 1 96.45 0.1117 0.7411 Price/Sq Ft 58293.360 3.9234 0.0583 (d) Below are JMP summaries of different regression models for predicting selling price y based on various combinations of the variables: Square Feet(x1), Price/Square Feet(x2) and Bathrooms(x3) From this output, state which model (i.e., selecting a combination of variables among x1, x2, x3) seems best for predicting y and give two reasons for your choice. (Cite values in the output to support your answer.) Number RSquare Model Variables: Cp Model RMSE AICC BIC Square Feet 0.5605 86.6916 334.278 337.274 202.3524 Price/Sq Ft 1 0.1311 121.894 353.362 356.358 423.4988 Bathrooms 1 0.0534 127.230 355.761 358.758 463.5412 Square Feet,Price/Sq Ft Square Feet, Bathrooms 0.9532 28.8546 274.314 277.903 2.1117 Reason #1: 0.6494 78.9607 330.688 334.277 158.5590 Price/Sq Ft,Bathrooms 0.3817 104.860 346.573 350.163 296.4294 Square Feet,Price/Sq Ft,Bathrooms 3 0.9534 29.3813 277.172 281.105 4.0000 Reason #2:
2. For the same houses from Question 1, a multiple regression model is now used to predict the price y (in $1000) of the n = 28 Seatle home prices based on two more explanatory variables in addition to square feet. The explanatory variables are then X1 = square feet ; Price/Square Feet; Bathrooms (Number of bathrooms). B1, B2 and B3 are the corresponding parameters in the model. For all the testing problem hereby, set significance level a = 0.05. Response Price ($000) Summary of Fit RSquare RSquare Adj Root Mean Square Error Mean of Response Observations (or Sum Wgts) 0.9534 0.947575 29.38132 Response Price ($000) Summary of Fit 356.8214 28 RSquare RSquare Adj Root Mean Square Error Mean of Response Observations (or Sum Wgts) 0.131114 0.097695 v Analysis of Variance 121.8935 Sum of 356.8214 Source DF Squares Mean Square F Ratio 28 Model 423883.82 141295 163.6752 Analysis of Variance Error 24 20718.29 863 Prob > F C. Total 27 444602.11 <.0001* Sum of Source DF Squares Mean Square F Ratio v Parameter Estimates Model 58293.36 58293.4 3.9234 Term Estimate Std Error t Ratio Prob>|t| 14858.0 Prob > F 0.0583 Error 26 386308.75 C. Total Intercept Square Feet 0.1895693 0.011048 Price/Sq Ft -371.4508 45.67288 -8.13 <.0001* 27 444602.11 17.16 <.0001* v Parameter Estimates 12.51 <.0001* -0.33 0.7411 1961.0355 156.728 Bathrooms -3.798639 11.36416 Term Estimate Std Error t Ratio Prob>|t| Intercept Price/Sq Ft 1089.7999 550.1965 v Effect Tests 149.87283 106.9894 1.40 0.1731 1.98 0.0583 Sum of Nparm F Ratio Prob > F Effect Tests Source DF Squares Square Feet Price/Sq Ft Bathrooms 254169.70 294.4294 <.0001* Sum of 135151.41 156.5590 <.0001* Source Nparm DF Squares F Ratio Prob > F 1 96.45 0.1117 0.7411 Price/Sq Ft 58293.360 3.9234 0.0583 (d) Below are JMP summaries of different regression models for predicting selling price y based on various combinations of the variables: Square Feet(x1), Price/Square Feet(x2) and Bathrooms(x3) From this output, state which model (i.e., selecting a combination of variables among x1, x2, x3) seems best for predicting y and give two reasons for your choice. (Cite values in the output to support your answer.) Number RSquare Model Variables: Cp Model RMSE AICC BIC Square Feet 0.5605 86.6916 334.278 337.274 202.3524 Price/Sq Ft 1 0.1311 121.894 353.362 356.358 423.4988 Bathrooms 1 0.0534 127.230 355.761 358.758 463.5412 Square Feet,Price/Sq Ft Square Feet, Bathrooms 0.9532 28.8546 274.314 277.903 2.1117 Reason #1: 0.6494 78.9607 330.688 334.277 158.5590 Price/Sq Ft,Bathrooms 0.3817 104.860 346.573 350.163 296.4294 Square Feet,Price/Sq Ft,Bathrooms 3 0.9534 29.3813 277.172 281.105 4.0000 Reason #2:

College Algebra
7th Edition
ISBN:9781305115545
Author:James Stewart, Lothar Redlin, Saleem Watson
Publisher:James Stewart, Lothar Redlin, Saleem Watson
Chapter1: Equations And Graphs
Section: Chapter Questions
Problem 10T: Olympic Pole Vault The graph in Figure 7 indicates that in recent years the winning Olympic men’s...

Related questions
Question
Site images for background and question.
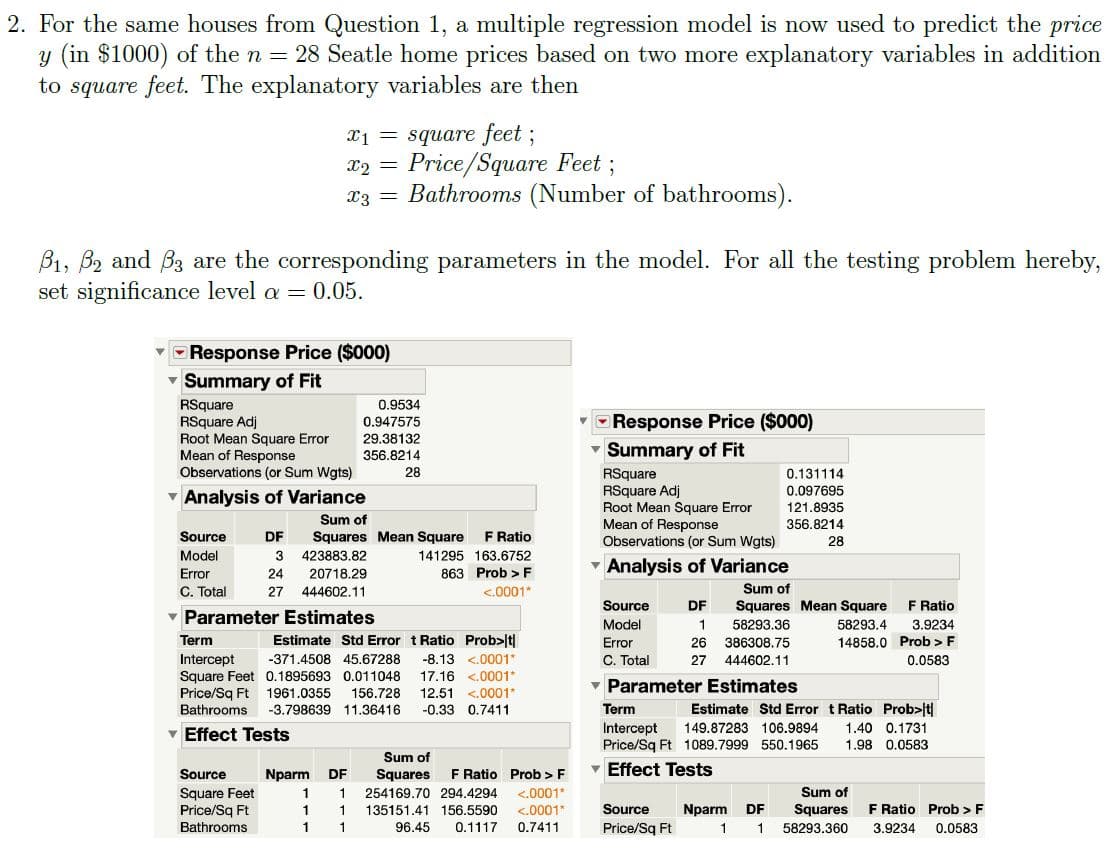
Transcribed Image Text:2. For the same houses from Question 1, a multiple regression model is now used to predict the price
y (in $1000) of the n = 28 Seatle home prices based on two more explanatory variables in addition
to square feet. The explanatory variables are then
X1 = square feet ;
Price/Square Feet;
Bathrooms (Number of bathrooms).
B1, B2 and B3 are the corresponding parameters in the model. For all the testing problem hereby,
set significance level a = 0.05.
Response Price ($000)
Summary of Fit
RSquare
RSquare Adj
Root Mean Square Error
Mean of Response
Observations (or Sum Wgts)
0.9534
0.947575
29.38132
Response Price ($000)
Summary of Fit
356.8214
28
RSquare
RSquare Adj
Root Mean Square Error
Mean of Response
Observations (or Sum Wgts)
0.131114
0.097695
v Analysis of Variance
121.8935
Sum of
356.8214
Source
DF
Squares Mean Square
F Ratio
28
Model
423883.82
141295 163.6752
Analysis of Variance
Error
24
20718.29
863 Prob > F
C. Total
27
444602.11
<.0001*
Sum of
Source
DF
Squares Mean Square
F Ratio
v Parameter Estimates
Model
58293.36
58293.4
3.9234
Term
Estimate Std Error t Ratio Prob>|t|
14858.0 Prob > F
0.0583
Error
26
386308.75
C. Total
Intercept
Square Feet 0.1895693 0.011048
Price/Sq Ft
-371.4508 45.67288
-8.13 <.0001*
27
444602.11
17.16 <.0001*
v Parameter Estimates
12.51 <.0001*
-0.33 0.7411
1961.0355
156.728
Bathrooms
-3.798639 11.36416
Term
Estimate Std Error t Ratio Prob>|t|
Intercept
Price/Sq Ft 1089.7999 550.1965
v Effect Tests
149.87283 106.9894
1.40 0.1731
1.98 0.0583
Sum of
Nparm
F Ratio Prob > F
Effect Tests
Source
DF
Squares
Square Feet
Price/Sq Ft
Bathrooms
254169.70 294.4294
<.0001*
Sum of
135151.41 156.5590
<.0001*
Source
Nparm
DF
Squares
F Ratio Prob > F
1
96.45
0.1117
0.7411
Price/Sq Ft
58293.360
3.9234
0.0583
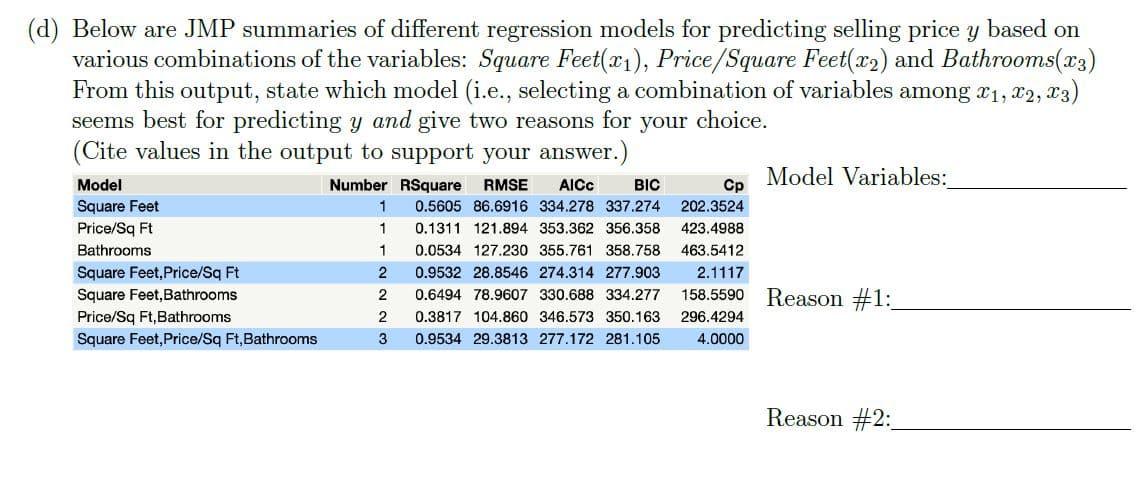
Transcribed Image Text:(d) Below are JMP summaries of different regression models for predicting selling price y based on
various combinations of the variables: Square Feet(x1), Price/Square Feet(x2) and Bathrooms(x3)
From this output, state which model (i.e., selecting a combination of variables among x1, x2, x3)
seems best for predicting y and give two reasons for your choice.
(Cite values in the output to support your answer.)
Number RSquare
Model Variables:
Cp
Model
RMSE
AICC
BIC
Square Feet
0.5605 86.6916 334.278 337.274
202.3524
Price/Sq Ft
1
0.1311 121.894 353.362 356.358
423.4988
Bathrooms
1
0.0534 127.230 355.761 358.758
463.5412
Square Feet,Price/Sq Ft
Square Feet, Bathrooms
0.9532 28.8546 274.314 277.903
2.1117
Reason #1:
0.6494 78.9607 330.688 334.277
158.5590
Price/Sq Ft,Bathrooms
0.3817 104.860 346.573 350.163
296.4294
Square Feet,Price/Sq Ft,Bathrooms
3
0.9534 29.3813 277.172 281.105
4.0000
Reason #2:
Expert Solution
This question has been solved!
Explore an expertly crafted, step-by-step solution for a thorough understanding of key concepts.

This is a popular solution!

Trending now
This is a popular solution!

Step by step
Solved in 2 steps

Knowledge Booster


Learn more about
Need a deep-dive on the concept behind this application? Look no further. Learn more about this topic, statistics and related others by exploring similar questions and additional content below.Recommended textbooks for you
College Algebra
Algebra
ISBN:
9781305115545
Author:
James Stewart, Lothar Redlin, Saleem Watson
Publisher:
Cengage Learning

Linear Algebra: A Modern Introduction
Algebra
ISBN:
9781285463247
Author:
David Poole
Publisher:
Cengage Learning

Functions and Change: A Modeling Approach to Coll…
Algebra
ISBN:
9781337111348
Author:
Bruce Crauder, Benny Evans, Alan Noell
Publisher:
Cengage Learning
College Algebra
Algebra
ISBN:
9781305115545
Author:
James Stewart, Lothar Redlin, Saleem Watson
Publisher:
Cengage Learning
Linear Algebra: A Modern Introduction
Algebra
ISBN:
9781285463247
Author:
David Poole
Publisher:
Cengage Learning
Functions and Change: A Modeling Approach to Coll…
Algebra
ISBN:
9781337111348
Author:
Bruce Crauder, Benny Evans, Alan Noell
Publisher:
Cengage Learning