2. In experiment 1, we discussed how one could compute concentrations of an element via XRF via two different methods. The first involved "recalibrating" analyzer response (plotting analyzer reported ppm Pb vs true ppm Pb). The second used first principles (plotting Pb La intensity / Compton peak intensity vs true ppm Pb). The table below shows results from determination of Pb in five different SRMs via these two methods. Determine whether or not these two methods give results that are statistically equivalent at the 50% confidence level. Repeat this calculation at the 95% confidence level. Be sure to show your work (i.e., computed mean, standard deviation, etc.) and how you arrived at your conclusion. Sample # Method 1 ppm Pb 21 152 434 1 2345 1186 1612 Method 2 ppm Pb 34 157 425 1076 1518
2. In experiment 1, we discussed how one could compute concentrations of an element via XRF via two different methods. The first involved "recalibrating" analyzer response (plotting analyzer reported ppm Pb vs true ppm Pb). The second used first principles (plotting Pb La intensity / Compton peak intensity vs true ppm Pb). The table below shows results from determination of Pb in five different SRMs via these two methods. Determine whether or not these two methods give results that are statistically equivalent at the 50% confidence level. Repeat this calculation at the 95% confidence level. Be sure to show your work (i.e., computed mean, standard deviation, etc.) and how you arrived at your conclusion. Sample # Method 1 ppm Pb 21 152 434 1 2345 1186 1612 Method 2 ppm Pb 34 157 425 1076 1518

MATLAB: An Introduction with Applications
6th Edition
ISBN:9781119256830
Author:Amos Gilat
Publisher:Amos Gilat
Chapter1: Starting With Matlab
Section: Chapter Questions
Problem 1P

Related questions
Question
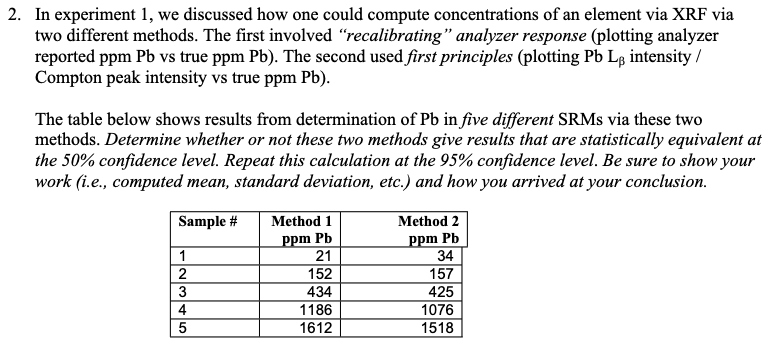
Transcribed Image Text:2. In experiment 1, we discussed how one could compute concentrations of an element via XRF via
two different methods. The first involved "recalibrating" analyzer response (plotting analyzer
reported ppm Pb vs true ppm Pb). The second used first principles (plotting Pb LB intensity /
Compton peak intensity vs true ppm Pb).
The table below shows results from determination of Pb in five different SRMs via these two
methods. Determine whether or not these two methods give results that are statistically equivalent at
the 50% confidence level. Repeat this calculation at the 95% confidence level. Be sure to show your
work (i.e., computed mean, standard deviation, etc.) and how you arrived at your conclusion.
Sample # Method 1
ppm Pb
1
2
1345
21
152
434
1186
1612
Method 2
ppm Pb
34
157
425
1076
1518
Expert Solution
This question has been solved!
Explore an expertly crafted, step-by-step solution for a thorough understanding of key concepts.

This is a popular solution!
Step 1: Write the information given in the question.
VIEWStep 2: Determine the null hypothesis and alternate hypothesis for the given scenario.
VIEWStep 3: Determine the mean, standard deviation of the differences(s), the standard error (S.E) of the mean d
VIEWStep 4: Perform the hypothesis test at significance level of 5%.
VIEWSolution
VIEW
Trending now
This is a popular solution!

Step by step
Solved in 5 steps

Recommended textbooks for you
MATLAB: An Introduction with Applications
Statistics
ISBN:
9781119256830
Author:
Amos Gilat
Publisher:
John Wiley & Sons Inc

Probability and Statistics for Engineering and th…
Statistics
ISBN:
9781305251809
Author:
Jay L. Devore
Publisher:
Cengage Learning

Statistics for The Behavioral Sciences (MindTap C…
Statistics
ISBN:
9781305504912
Author:
Frederick J Gravetter, Larry B. Wallnau
Publisher:
Cengage Learning
MATLAB: An Introduction with Applications
Statistics
ISBN:
9781119256830
Author:
Amos Gilat
Publisher:
John Wiley & Sons Inc
Probability and Statistics for Engineering and th…
Statistics
ISBN:
9781305251809
Author:
Jay L. Devore
Publisher:
Cengage Learning
Statistics for The Behavioral Sciences (MindTap C…
Statistics
ISBN:
9781305504912
Author:
Frederick J Gravetter, Larry B. Wallnau
Publisher:
Cengage Learning

Elementary Statistics: Picturing the World (7th E…
Statistics
ISBN:
9780134683416
Author:
Ron Larson, Betsy Farber
Publisher:
PEARSON

The Basic Practice of Statistics
Statistics
ISBN:
9781319042578
Author:
David S. Moore, William I. Notz, Michael A. Fligner
Publisher:
W. H. Freeman

Introduction to the Practice of Statistics
Statistics
ISBN:
9781319013387
Author:
David S. Moore, George P. McCabe, Bruce A. Craig
Publisher:
W. H. Freeman