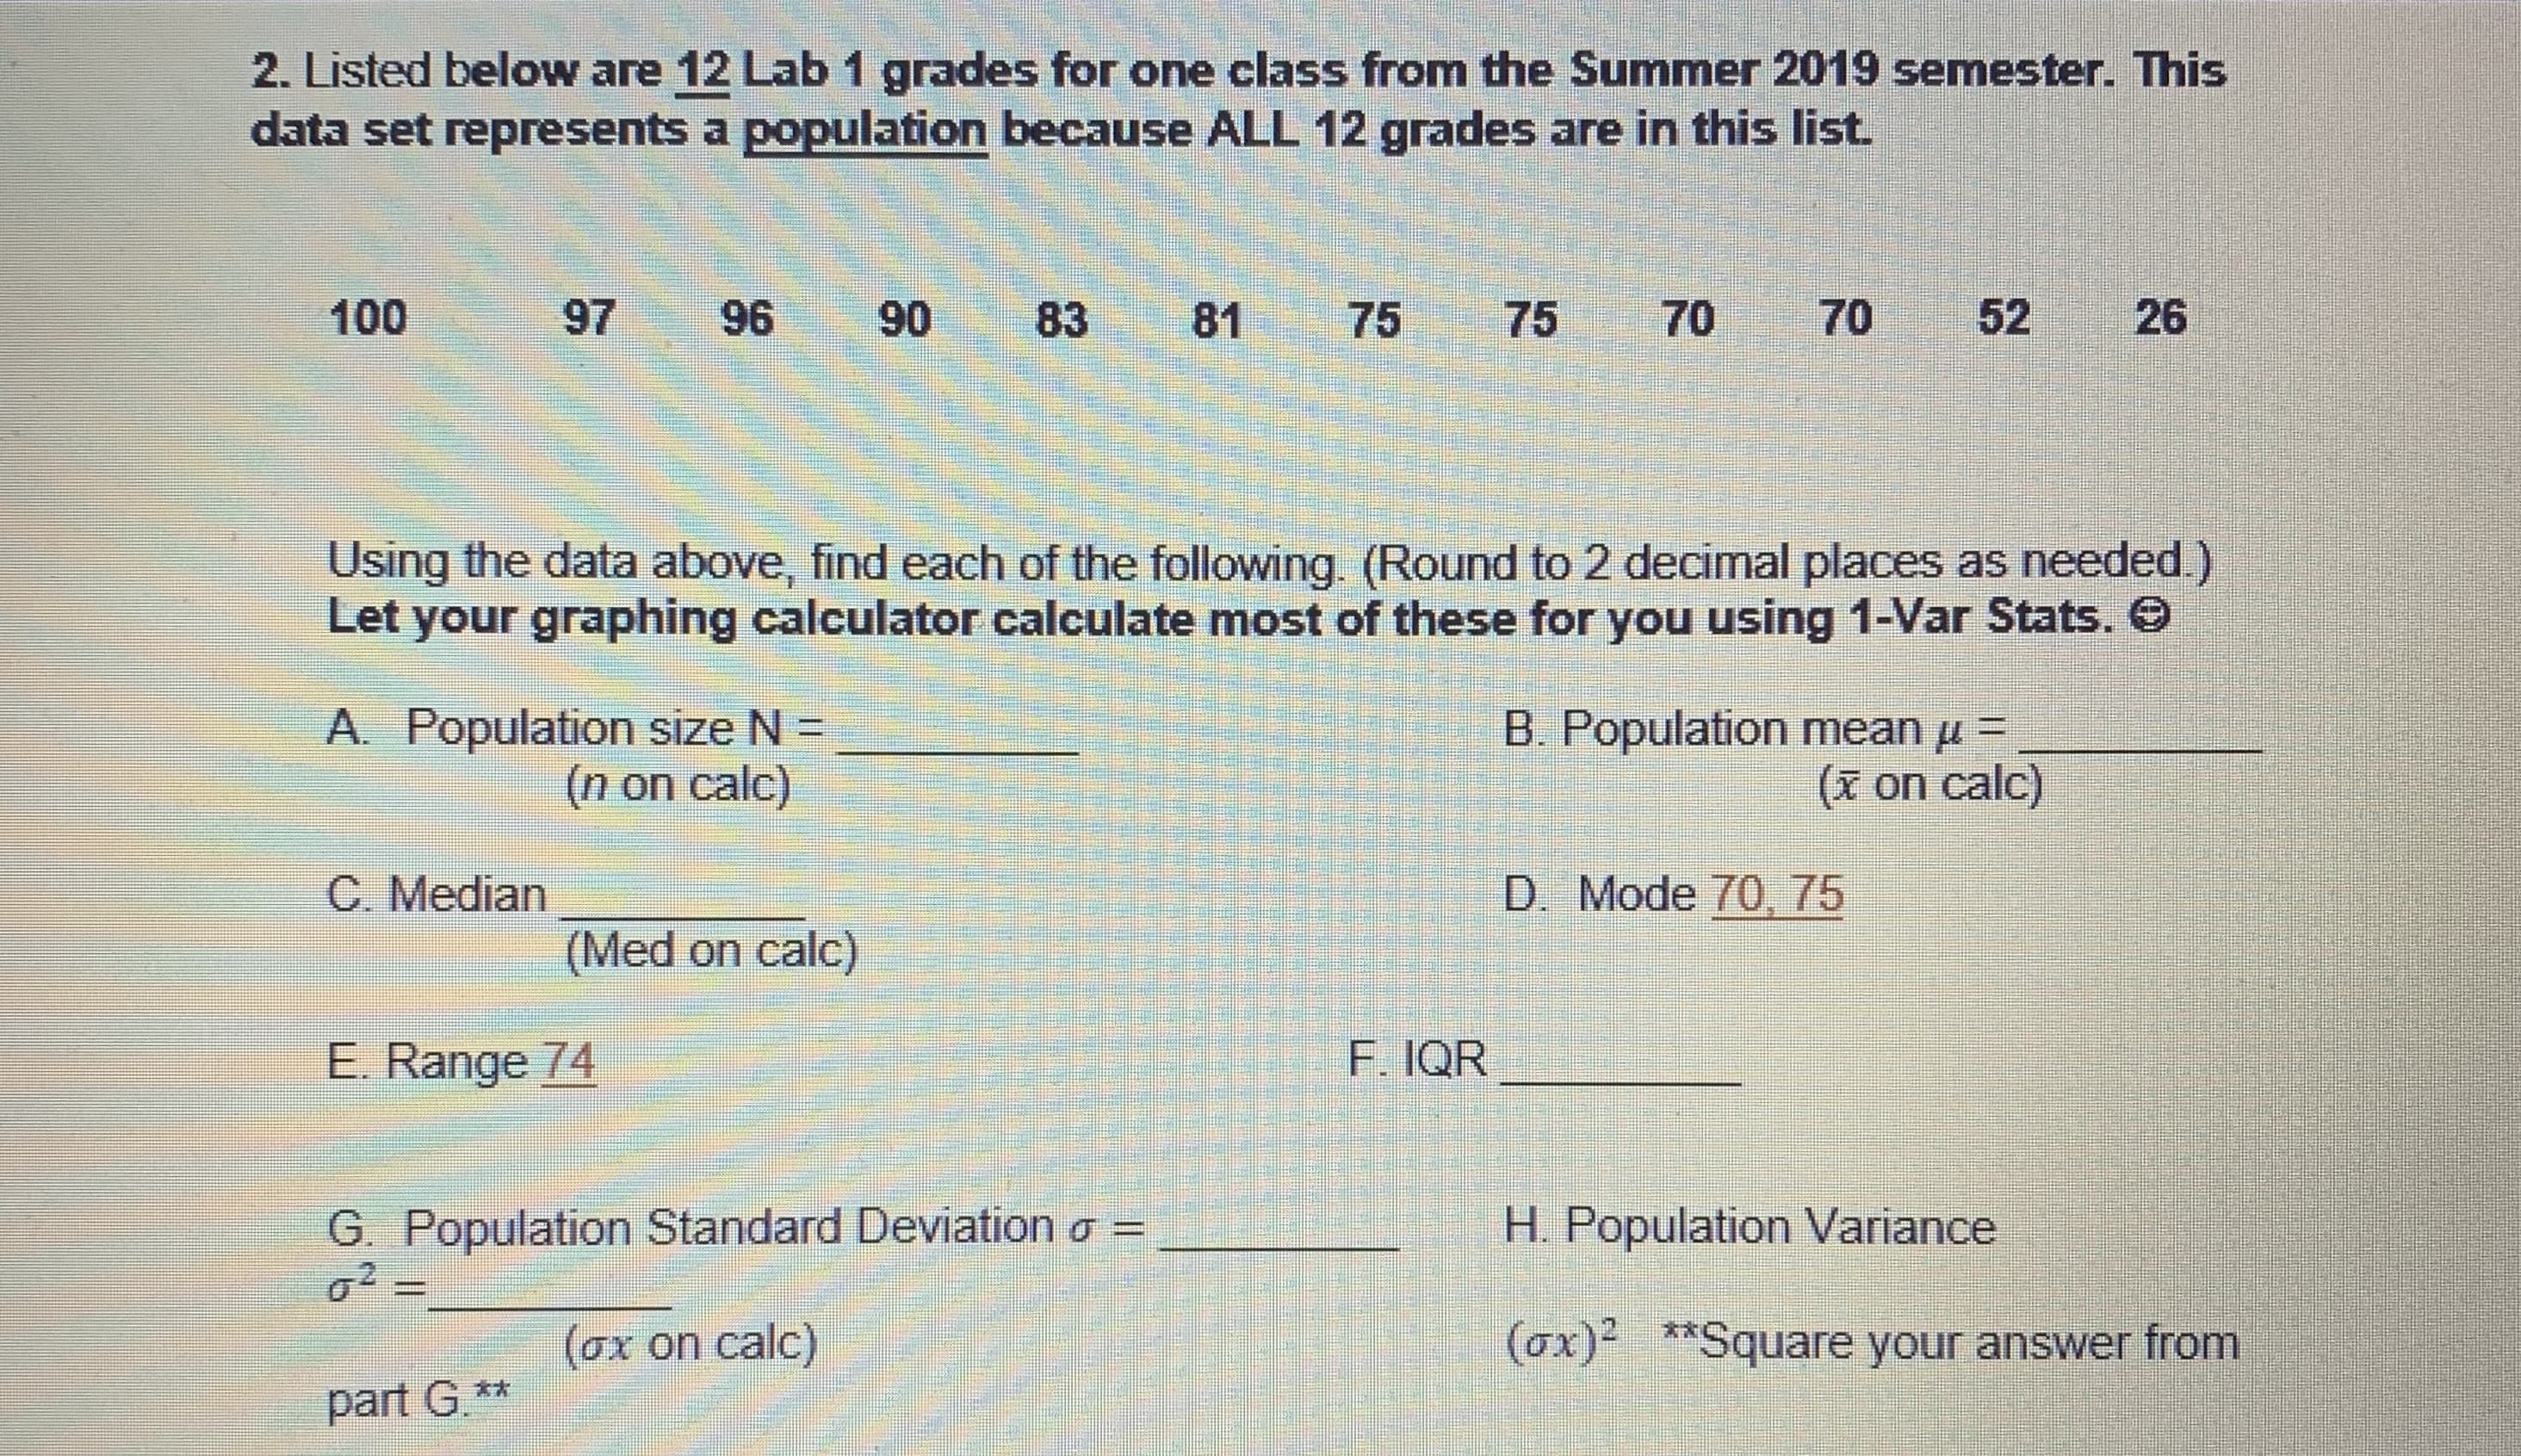
2. Listed below are 12 Lab 1 grades for one class from the Summer 2019 semester. This data set represents a population because ALL 12 grades are in this list. 100 97 96 90 83 81 75 75 70 70 52 26 Using the data above, find each of the following. (Round to 2 decimal places as needed.) Let your graphing calculator calculate most of these for you using 1-Var Stats. O A. Population size N = (n on calc) B. Population mean u = (x on calc) C. Median D. Mode 70, 75 (Med on calc) E. Range 74 F. IQR G. Population Standard Deviation o = o2 = H. Population Variance (ox on calc) (ox)- **Square your answer from part G.**


Inverse Normal Distribution
The method used for finding the corresponding z-critical value in a normal distribution using the known probability is said to be an inverse normal distribution. The inverse normal distribution is a continuous probability distribution with a family of two parameters.
Mean, Median, Mode
It is a descriptive summary of a data set. It can be defined by using some of the measures. The central tendencies do not provide information regarding individual data from the dataset. However, they give a summary of the data set. The central tendency or measure of central tendency is a central or typical value for a probability distribution.
Z-Scores
A z-score is a unit of measurement used in statistics to describe the position of a raw score in terms of its distance from the mean, measured with reference to standard deviation from the mean. Z-scores are useful in statistics because they allow comparison between two scores that belong to different normal distributions.
A. Population ?
B. Population mean ?
C. Median ?
F. IQR ?
G. Population standard deviation ?
H. population variance ?


Trending now
This is a popular solution!

Step by step
Solved in 4 steps with 4 images


