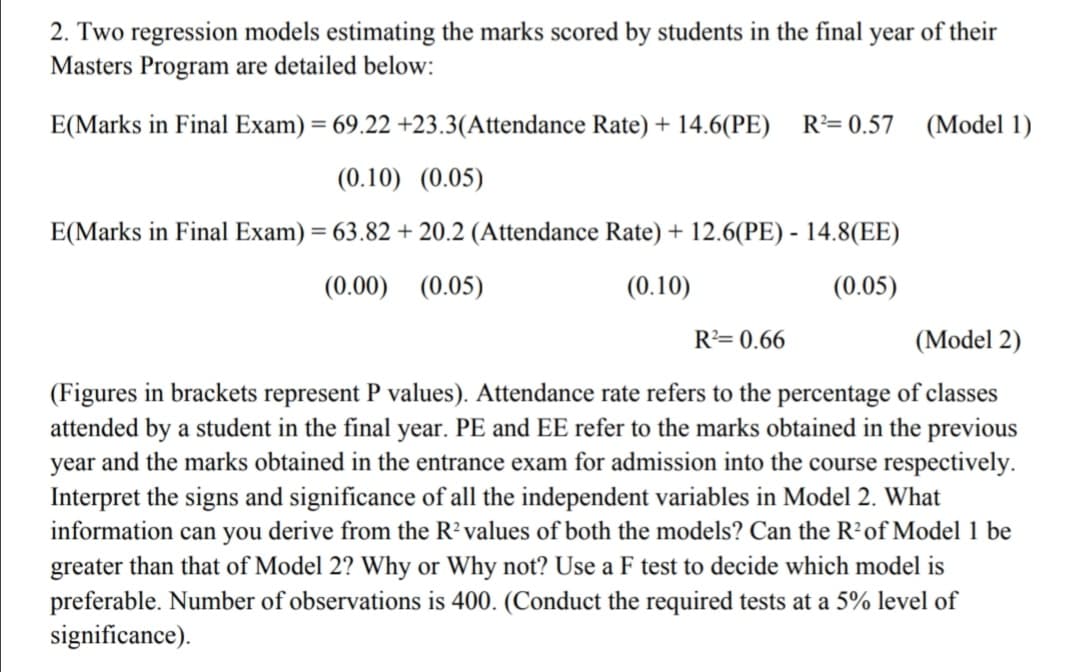
2. Two regression models estimating the marks scored by students in the final year of their Masters Program are detailed below: E(Marks in Final Exam) = 69.22 +23.3(Attendance Rate) + 14.6(PE) R= 0.57 (Model 1) (0.10) (0.05) E(Marks in Final Exam) = 63.82 + 20.2 (Attendance Rate) + 12.6(PE) - 14.8(EE) (0.00) (0.05) (0.10) (0.05) R= 0.66 (Model 2) (Figures in brackets represent P values). Attendance rate refers to the percentage of classes attended by a student in the final year. PE and EE refer to the marks obtained in the previous year and the marks obtained in the entrance exam for admission into the course respectively. Interpret the signs and significance of all the independent variables in Model 2. What information can you derive from the R? values of both the models? Can the R'of Model 1 be greater than that of Model 2? Why or Why not? Use a F test to decide which model is preferable. Number of observations is 400. (Conduct the required tests at a 5% level of significance).


Correlation
Correlation defines a relationship between two independent variables. It tells the degree to which variables move in relation to each other. When two sets of data are related to each other, there is a correlation between them.
Linear Correlation
A correlation is used to determine the relationships between numerical and categorical variables. In other words, it is an indicator of how things are connected to one another. The correlation analysis is the study of how variables are related.
Regression Analysis
Regression analysis is a statistical method in which it estimates the relationship between a dependent variable and one or more independent variable. In simple terms dependent variable is called as outcome variable and independent variable is called as predictors. Regression analysis is one of the methods to find the trends in data. The independent variable used in Regression analysis is named Predictor variable. It offers data of an associated dependent variable regarding a particular outcome.

Step by step
Solved in 4 steps with 3 images


