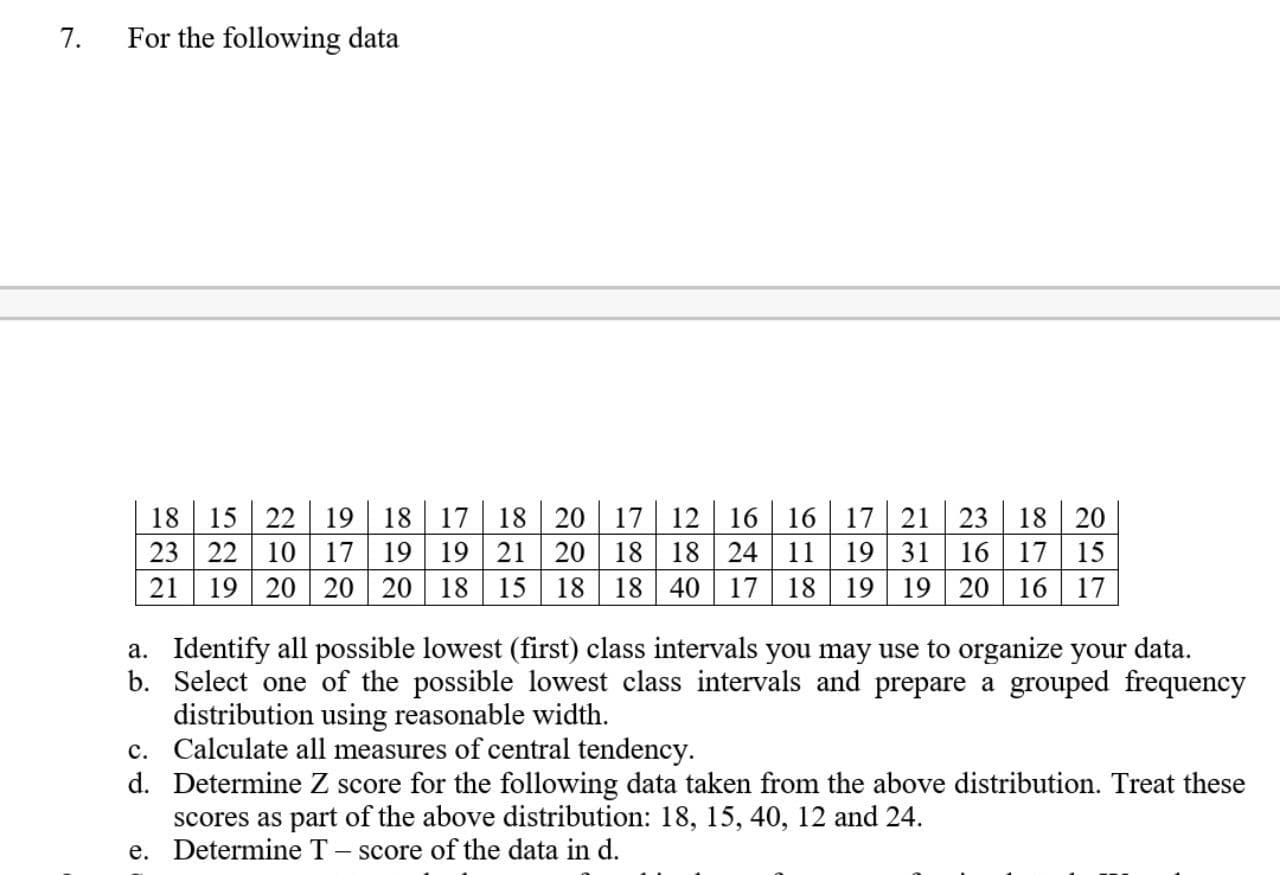
20 17 12 19 19 21 20 | 18 15 22 16 | 16 18 24 11 17 21 19 31 18 19 18 17 18 23 18 | 20 23 22 10 17 16 17 15 21 19 20 20 20 | 18 15 18 18 40 17 18 | 19 19 20 | 16 17 a. Identify all possible lowest (first) class intervals you may use to organize your data. b. Select one of the possible lowest class intervals and prepare a grouped frequency distribution using reasonable width. c. Calculate all measures of central tendency. d. Determine Z score for the following data taken from the above distribution. Treat these scores as part of the above distribution: 18, 15, 40, 12 and 24. e. Determine T - score of the data in d.
20 17 12 19 19 21 20 | 18 15 22 16 | 16 18 24 11 17 21 19 31 18 19 18 17 18 23 18 | 20 23 22 10 17 16 17 15 21 19 20 20 20 | 18 15 18 18 40 17 18 | 19 19 20 | 16 17 a. Identify all possible lowest (first) class intervals you may use to organize your data. b. Select one of the possible lowest class intervals and prepare a grouped frequency distribution using reasonable width. c. Calculate all measures of central tendency. d. Determine Z score for the following data taken from the above distribution. Treat these scores as part of the above distribution: 18, 15, 40, 12 and 24. e. Determine T - score of the data in d.

MATLAB: An Introduction with Applications
6th Edition
ISBN:9781119256830
Author:Amos Gilat
Publisher:Amos Gilat
Chapter1: Starting With Matlab
Section: Chapter Questions
Problem 1P

Related questions
Question
I really want your help so can you help me to solve this questions
Transcribed Image Text:20 17 12
19 19 21 20 | 18
15 22
16 | 16
18 24 11
17 21
19 31
18
19
18
17
18
23
18 | 20
23
22
10
17
16
17
15
21
19 20 20 20 | 18 15 18 18 40 17 18 | 19 19 20 | 16 17
a. Identify all possible lowest (first) class intervals you may use to organize your data.
b. Select one of the possible lowest class intervals and prepare a grouped frequency
distribution using reasonable width.
c. Calculate all measures of central tendency.
d. Determine Z score for the following data taken from the above distribution. Treat these
scores as part of the above distribution: 18, 15, 40, 12 and 24.
e. Determine T - score of the data in d.
Expert Solution
This question has been solved!
Explore an expertly crafted, step-by-step solution for a thorough understanding of key concepts.

This is a popular solution!

Trending now
This is a popular solution!

Step by step
Solved in 3 steps with 5 images

Knowledge Booster


Learn more about
Need a deep-dive on the concept behind this application? Look no further. Learn more about this topic, statistics and related others by exploring similar questions and additional content below.Recommended textbooks for you
MATLAB: An Introduction with Applications
Statistics
ISBN:
9781119256830
Author:
Amos Gilat
Publisher:
John Wiley & Sons Inc

Probability and Statistics for Engineering and th…
Statistics
ISBN:
9781305251809
Author:
Jay L. Devore
Publisher:
Cengage Learning

Statistics for The Behavioral Sciences (MindTap C…
Statistics
ISBN:
9781305504912
Author:
Frederick J Gravetter, Larry B. Wallnau
Publisher:
Cengage Learning
MATLAB: An Introduction with Applications
Statistics
ISBN:
9781119256830
Author:
Amos Gilat
Publisher:
John Wiley & Sons Inc
Probability and Statistics for Engineering and th…
Statistics
ISBN:
9781305251809
Author:
Jay L. Devore
Publisher:
Cengage Learning
Statistics for The Behavioral Sciences (MindTap C…
Statistics
ISBN:
9781305504912
Author:
Frederick J Gravetter, Larry B. Wallnau
Publisher:
Cengage Learning

Elementary Statistics: Picturing the World (7th E…
Statistics
ISBN:
9780134683416
Author:
Ron Larson, Betsy Farber
Publisher:
PEARSON

The Basic Practice of Statistics
Statistics
ISBN:
9781319042578
Author:
David S. Moore, William I. Notz, Michael A. Fligner
Publisher:
W. H. Freeman

Introduction to the Practice of Statistics
Statistics
ISBN:
9781319013387
Author:
David S. Moore, George P. McCabe, Bruce A. Craig
Publisher:
W. H. Freeman