2013 study investigated employees' self-rated job performance on a scale from 0 (worst) to 10 (best). The study surveyed workers at three different companies. Response rates at each company ranged from 40% to 80%. Of the roughly 20,000 total respondents, about 75% came from one company. After accounting for several other variables, the authors found that the mean self- rated job performance by women was 0.07 points higher than the mean self-rated job performance by men. The p-value for their hypothesis test was less than 0.001. A) Is this result statistically significant at the 5% level? B) Is this result practically significant? Explain why or why not. One variable the authors accounted for was whether the employees were depressed. 2,750 respondents claimed to have been diagnosed with depression, and 17,364 claimed not to have been. Construct, but do not interpret, a 90% confidence interval for the population proportion of workers who suffer from depression. C) D) Is it a valid interpretation to claim that in 90% of workplaces, the proportion of depressed workers is in the interval you calculated in part C? E) Assume you got part C correct. What problem(s), if any, do you have with the interpretation, "We are 90% confident that the proportion of depressed workers is within that interval"? Think about the methods of both constructing the confidence interval and obtaining the data used to create it.
2013 study investigated employees' self-rated job performance on a scale from 0 (worst) to 10 (best). The study surveyed workers at three different companies. Response rates at each company ranged from 40% to 80%. Of the roughly 20,000 total respondents, about 75% came from one company. After accounting for several other variables, the authors found that the mean self- rated job performance by women was 0.07 points higher than the mean self-rated job performance by men. The p-value for their hypothesis test was less than 0.001. A) Is this result statistically significant at the 5% level? B) Is this result practically significant? Explain why or why not. One variable the authors accounted for was whether the employees were depressed. 2,750 respondents claimed to have been diagnosed with depression, and 17,364 claimed not to have been. Construct, but do not interpret, a 90% confidence interval for the population proportion of workers who suffer from depression. C) D) Is it a valid interpretation to claim that in 90% of workplaces, the proportion of depressed workers is in the interval you calculated in part C? E) Assume you got part C correct. What problem(s), if any, do you have with the interpretation, "We are 90% confident that the proportion of depressed workers is within that interval"? Think about the methods of both constructing the confidence interval and obtaining the data used to create it.

Glencoe Algebra 1, Student Edition, 9780079039897, 0079039898, 2018
18th Edition
ISBN:9780079039897
Author:Carter
Publisher:Carter
Chapter4: Equations Of Linear Functions
Section4.5: Correlation And Causation
Problem 11PPS

Related questions
Topic Video
Question
Please need help with homework question
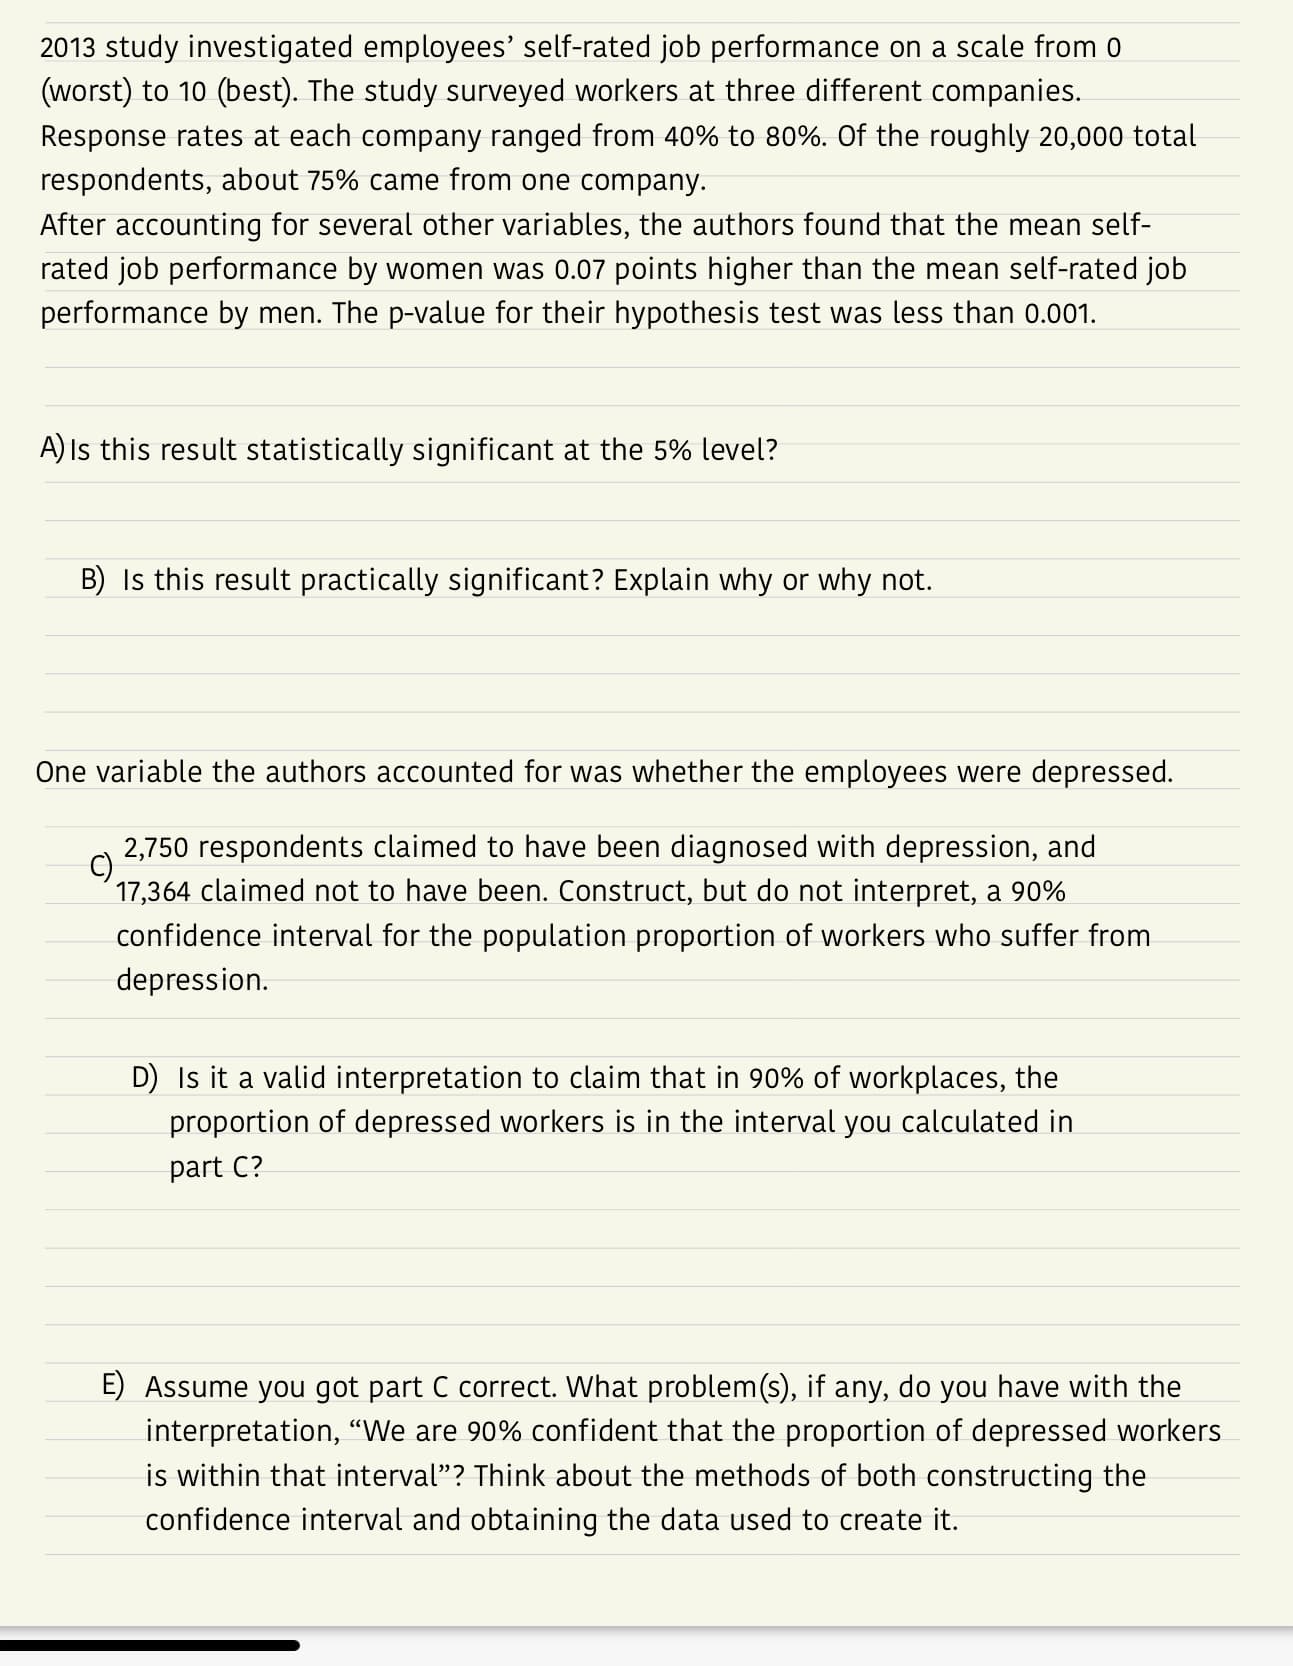
Transcribed Image Text:2013 study investigated employees' self-rated job performance on a scale from 0
(worst) to 10 (best). The study surveyed workers at three different companies.
Response rates at each company ranged from 40% to 80%. Of the roughly 20,000 total
respondents, about 75% came from one company.
After accounting for several other variables, the authors found that the mean self-
rated job performance by women was 0.07 points higher than the mean self-rated job
performance by men. The p-value for their hypothesis test was less than 0.001.
A) Is this result statistically significant at the 5% level?
B) Is this result practically significant? Explain why or why not.
One variable the authors accounted for was whether the employees were depressed.
2,750 respondents claimed to have been diagnosed with depression, and
17,364 claimed not to have been. Construct, but do not interpret, a 90%
confidence interval for the population proportion of workers who suffer from
depression.
C)
D) Is it a valid interpretation to claim that in 90% of workplaces, the
proportion of depressed workers is in the interval you calculated in
part C?
E) Assume you got part C correct. What problem(s), if any, do you have with the
interpretation, "We are 90% confident that the proportion of depressed workers
is within that interval"? Think about the methods of both constructing the
confidence interval and obtaining the data used to create it.
Expert Solution
This question has been solved!
Explore an expertly crafted, step-by-step solution for a thorough understanding of key concepts.

This is a popular solution!

Trending now
This is a popular solution!

Step by step
Solved in 5 steps with 2 images

Knowledge Booster


Learn more about
Need a deep-dive on the concept behind this application? Look no further. Learn more about this topic, statistics and related others by exploring similar questions and additional content below.Recommended textbooks for you
Glencoe Algebra 1, Student Edition, 9780079039897…
Algebra
ISBN:
9780079039897
Author:
Carter
Publisher:
McGraw Hill

Big Ideas Math A Bridge To Success Algebra 1: Stu…
Algebra
ISBN:
9781680331141
Author:
HOUGHTON MIFFLIN HARCOURT
Publisher:
Houghton Mifflin Harcourt

College Algebra (MindTap Course List)
Algebra
ISBN:
9781305652231
Author:
R. David Gustafson, Jeff Hughes
Publisher:
Cengage Learning
Glencoe Algebra 1, Student Edition, 9780079039897…
Algebra
ISBN:
9780079039897
Author:
Carter
Publisher:
McGraw Hill
Big Ideas Math A Bridge To Success Algebra 1: Stu…
Algebra
ISBN:
9781680331141
Author:
HOUGHTON MIFFLIN HARCOURT
Publisher:
Houghton Mifflin Harcourt
College Algebra (MindTap Course List)
Algebra
ISBN:
9781305652231
Author:
R. David Gustafson, Jeff Hughes
Publisher:
Cengage Learning