2018 2017 Cash $ 58,000 $ 47,000 Short-term Investments 34,000 Net Accounts Receivable 140,000 124,000 Merchandise Inventory 217,000 272,000 Total Assets 530,000 565,000 Total Current Liabilities 288,000 205,000 Long-term Notes Payable 40,000 50,000 Income from Operations 165,000 158,000 Interest Expense 55,000 41,000


Q: Selected financial data for Surf City and Paradise Falls are as follows:Required:1. Calculate the…
A:
Q: Write report on liquidity, profitability, growth, solvency, Leverage and operational performance of…
A: Liquidity ratios are: Current ratio, quick ratio/Acid test ratio, Collection period/Average days…
Q: Please describe what is meant by “Times Interest Earned.” How is it calculated? Suppose you…
A: Ratios are an important tool for analysis of the financial statements to assess a firm's liquidity,…
Q: You are provided with the Income Statement and the Balance Sheet of HTS software, Inc. for 2011.…
A: Formulae Current Ratio= Current assets/ Current Liabilities Quick ratio=…
Q: Using the Balance Sheets and Income Statement below, please calculate the following ratios for…
A: The times interest earned ratio provides information regarding the capability of the company in…
Q: Ratio of liabilities to owner's equity The following data were taken from Mesa Company's balance…
A: The debt to equity ratio measures the risk associated to shareholders.
Q: a. Compute the firm's 2016 net operating income and net income. b. Calculate the firm's operating…
A: Operating Return on Assets: This ratio shows the efficiency of the management in generating…
Q: nalyze the financial statements of the company to you in terms of: 1. Profitability Ratio:…
A: Ratio Analysis The purpose of preparing the ratio is to know the strength and weakness of the…
Q: You are a financial Manager of Chevron Corp. You need to assess the effectiveness of working capital…
A: Receivable Turnover Ratio: In business, the efficiency with which a firm collects on its receivables…
Q: Period Ending: 12/31/2020 12/31/2019 12/31/2018 12/31/2017 Liquidity Ratios Current Ratio…
A: The balance sheet consists of Assets which includes noncurrent assets, Current assets and…
Q: Using the Balance Sheets and Income Statement below, please calculate the following ratios for…
A: total asset turnover=net salestotal asset inventory turnover=cost of goods soldinventory receivable…
Q: Which of the following statement is correct? Select one: a. Return on assets is the ratio of net…
A: The ratio is the measure of a relationship between two figures. In accounting, ratio analysis is…
Q: Perform the common sizing analysis for 2019 and 2018. Comment on your observations on the changes in…
A: Since we only answer up to 3 sub-parts, we’ll answer the first 3. Please resubmit the question and…
Q: Based on table below , is your company doing better or worse than last year? Explain your answer.…
A: The financial report analysis is the analysis method that is followed by a business to compare and…
Q: Please find below Financial Statement extracts of Nestle from year 2017 and 2018. Based on this…
A: The question is related to Ratio Analysis. The financial of year 2017 and 2018 are given. Required:-…
Q: a. what are the debt to equity ratios at the beginning and the end of the 2018 fiscal business year?…
A: The debt to equity ratio indicates the amount of debt held by an entity in comparison to the equity.…
Q: Required: Compute the ratios (according to the listed ratios as above) for 2019 and 2020. Analyse…
A: The computation of different ratios, analysis and interpretation are presented hereunder : Current…
Q: Calculate the businesses financial ratio for 2015. Assume that Park Ridge had 18,000 in lease…
A: Current ratio, quick ratio and cash ratio are measures of the liquidity position of a company, so…
Q: Assigning a Long-Term Debt Rating Using Financial Ratios Refer to the information below from…
A: Given : Revenue $13,601 Interest expense, gross $181 Depreciation expense 306 Dividends,…
Q: Balance Sheet i. What are Mydeco’s Accounts Receivable (A/R) in 2019? What is their percentage…
A: Comparative balance sheet shows balance sheets for two or more than two period. This is used for…
Q: Below is the balance sheet and income statement for Chin Corporation. You are needed to analyze the…
A: Following is the horizontal, vertical and ratio analysis
Q: Income statement and balance sheet data for The Athletic Attic are provided below. Required: 1.…
A: The ratio analysis helps to analyze the financial statements of the business.
Q: Analyze the financial statements of the company to you in terms of:…
A: Ratio Analysis - The ratio is the technique used by the prospective investor or an individual or…
Q: Use the image shown attached 1 (As balance sheet) and 2 (income statement) financial statements for…
A: Since you have asked multiple questions we will solve the first question for you,If you want any…
Q: Assigning a Long-Term Debt Rating Using Financial Ratios Refer to the information below from…
A: Financial Ratios: Financial ratios are computed from the data mainly found in the financial…
Q: 1. Using the financial statements above, prepare a common size income statement and balance sheet.…
A: Financial analysis is the process of assessing a company's performance in relation to its industry…
Q: Calculate the financial indicators of the firm Merck for the year 2018 and fill in the spaces marked…
A: Ratio is the tool which is used to measure the performance and growth of the company. It is also…
Q: A.Profitability ratio a. Return on Assets: ROA (NI/Total Assets) ROA (NI/Average Assets) ROA…
A: Hi student Since there are multiple subparts, we will answer only first three subparts.
Q: Calculate the average life, average age, and asset turnover ratios for Exxon Mobil. Discuss what…
A: Average life or age of an inventory means the time taken by inventory in the store before it sales…
Q: a. Given the debtor's collection period, stock days on hand and creditors payment period for 2020…
A: We know the basic formula to calculate the average collection period = Number of Days in One years /…
Q: he following data were taken from Alvarado Company’s balance sheet: OBJ. 6 Dec. 31, 2019 Total…
A: Debt to equity ratio is a financial ratio measuring the relationship of total outside liabilities to…
Q: Analyze the financial statements of the company to you in terms of: 1. Solvency Ratio:…
A: As per the honor code, we only answer up to 3 sub-parts, we’ll answer the first 3. Please resubmit…
Q: Ratio 2010 2011 Industry 2011 Current Ratio 2.6 — 2.7…
A: Ratio analysis is used to examine a company's financial trend of outcomes over time. There are five…
Q: RATIO ANALYSIS The Corrigan Corporation's 2017 and 2018 financialstatements follow, along with some…
A: Since you have posted a question with multiple sub-parts, we will solve first three sub-parts for…
Q: Solve the following ratios from year 2018-2020. Show complete solutions/computations. -CURRENT RATIO…
A: Current ratio is the ratio of Current assets to current liabilities. The current ratio is a…
Q: Using the Balance Sheets and Income Statement below, please calculate the following ratios for…
A: ACCORDING TO THE RULE, WE WILL ANSWER THE FIRST THREE SUBPARTS, FOR THE REMAINING SUBPARTS, KINDLY…
Q: Calculate the amount that would be reflected as “Working capital changes” in the Statement of Cash…
A: As per Bartleby Guidelines if multiple questions are asked and those are interlinked to each other…
Q: Based on this analysis how would I assess the financial stability and operational efficiency of this…
A: Acid Test Ratio reflects a firm's balance sheet whether it has sufficient short-term assets to cover…
Q: SMART TOYS CORPORATION INCOME STATEMENT For the following questions , please state year 2019 or 2018…
A: Ratio Analysis Ratio Analysis is one of the power tool to the management of the company to ascertain…
Q: Based on your observation by using financial statement analysis, is Bruce Company's overall…
A: To evaluate the performance of Bruce company for the year 2021 compared to the year 2020, we will…
Q: Question 1 Below is an extract of the Big Bhd. financial ratios for the year ended 31 December 2019…
A: Financial ratios are computed to attain overall information of the organization. There are different…
Q: Analyze your company’s liability section of the comparative balance sheets. Has the composition of…
A: Change in the composition of current and long-term liabilities of Walmart’s balance sheet over a…
Q: how to creat a balance sheet using the following information? Balance sheet Given the following…
A: The balance sheet is a summary of permanent accounts prepared at the end of the accounting period.…
Q: RATIO ANALYSIS The Corrigan Corporation's 2014 and 2015 financial statements follow, along with some…
A: SOLUTION- FORMULAS- 1- CURRENT RATIO = CURRENT ASSETS / CURRENT LIABILITIES. 2-INVENTORY TURN OVER =…
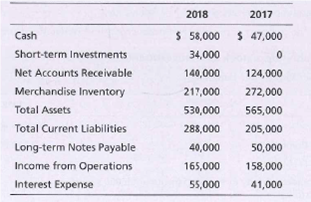
Analyzing the ability to pay liabilities
Big Beautiful Photo Shop has asked you to determine whether the company’s ability to pay current liabilities and total liabilities improved or deteriorated during 2018. To answer this question, you gather the following data:
Compute the following ratios for 2018 and 2017, and evaluate the company’s ability to Pay its current Liabilities and total liabilities:
a.
b. Cash ratio
c. Acid-test ratio
d. Debt ratio
e. Debt to equity ratio


Trending now
This is a popular solution!

Step by step
Solved in 2 steps


- ADDITIONAL FUNDS NEEDED Morrissey Technologies Inc.s 2016 financial statements are shown here. Morrissey Technologies Inc.: Balance Sheet as of December 31, 2016 Morrissey Technologies Inc.: Income Statement for December 31, 2016 Sales 3,600,000 Operating costs including depredation 3,279,720 EBIT 320,280 Interest 20,280 EBT 300,000 Taxes (40%) 120,000 Net Income 180,000 Per Share Data: Common stock price 45.00 Earnings per share (EPS) 1.80 Dividends per share (DPS) 1.08 Suppose that in 2017, sales increase by 10% over 2016 sales. The firm currently has 100,000 shares outstanding. It expects to maintain its 2016 dividend payout ratio and believes that its assets should grow at the same rate as sales. The firm has no excess capacity. However, the firm would like to reduce its operating costs/sales ratio to 87.5% and increase its total liabilities-to-assets ratio to 30%. (It believes its liabilities-to-assets ratio currently is too low relative to the industry average.) The firm will raise 30% of the 2017 forecasted interest- bearing debt as notes payable, and it will issue long-term bonds for the remainder. The firm forecasts that its before-tax cost of debt (which includes both short- and long-term debt) is 12.5%. Assume that any common stock issuances or repurchases can be made at the firms current stock price of 45. a. Construct the forecasted financial statements assuming that these changes are made. What are the firms forecasted notes payable and long-term debt balances? What is the forecasted addition to retained earnings? b. If the profit margin remains at 5% and the dividend payout ratio remains at 60%, at what growth rate in sales will the additional financing requirements be exactly zero? In other words, what is the firms sustainable growth rate? (Hint: Set AFN equal to zero and solve for g.)Maple Group LtdComparative Balance SheetDecember 31, 2020 and 20192020 2019 Increase/(Decrease)Assets Cash and cash equivalent ? 31,500 (10,000)Accounts Receivable ? 87,500 ? Inventories 97,100 ? ? Fixed Assets, net 142,300 ? 32,000 Total Assets 302,900 323,000 (20,100)Liabilities Accounts payable 25,600 26,600 ? Accrued liabilities 24,000 ? 1,200 Long-term notes payable 58,200 ? (20,000)Stockholders' Equity: Common Stock ? 131,400 ? Retained earnings 54,800 64,000 (9,200)Total liabilities and stockholders' equity 302,900 323,000 (20,100)- - - Maple Group Ltd Income Statement Year Ended December 31,2020 Revenues and gains: Sales revenue 370,000 Interest revenue 11,800 Total revenues and gains 381,800 Expenses Cost of goods sold 205,500 Depreciation expense 15,500 Other operating expense 126,000 Interest expense 24,300 Total expenses 371,300 Income before income taxes 10,500 Income tax expense 16,300 Net Loss (5,800) Notes Acquisition of fixed asset during 2020 47,500 Sale proceed…BnB Construction Inc.Balance Sheet (Millions of Dollars) Assets 2021 Est 2020 2019 Liabilities 2021 Est 2020 2019 Cash and Cash Equivalents 15 10 15 Accounts payable 115 60 30 Short-Term Investments 10 0 65 Overdrafts 115 110 60 Accounts Receivable 420 375 315 Accruals 260 140 130 Inventories 700 615 415 Total Current Liabilities 490 310 220 Total Current Assets 1145 1000 810 Long -Term Bonds and New Loan 1300 754 580 Net Plant and Equipment 1884 1190 870 Total Debt 1790 1064 800 Preferred Stock 40 40 40 Common Stock 130 130 130 Retained Earnings 1069 956 710 Total Common Equity 1199 1086 840 Total Assets 3029 2190 1680 Total Liabilities and Equity 3,029 2,190 1,680 Included is the Income Statement. Requirements: 1. Calculate the EPS, DPS, and BVPS, and Cash…
- 2013 2014 Sales$4,500 $4,775 Depreciation7501050COGS24222430Interest180215Cash200400Accts Receivables200300Notes Payable100150Long-term debt29561850Net fixed assets80009200Accounts Payable50100Inventory18001600Dividends225275Tax rate35%35% 1. What is the cash flow from operating activities? 2. What is the cash flow from financing activities? What is the days sales in accounts receivable or the AR period?1. The balance sheets at the end of each of the first two years of operations indicate the following:20172016Total current assets$600,000$560,000Total investments60,00040,000Total property, plant, and equipment900,000700,000Total current liabilities125,00080,000Total long-term liabilities350,000250,000Preferred 9% stock, $100 par100,000100,000Common stock, $10 par600,000600,000Paid-in capital in excess of par--common stock60,00060,000Retained earnings325,000210,000Based on the above information, if net income is $130,000 and interest expense is $40,000 for 2017, and the market price is $40, what is the price-earnings ratio on common stock (round to one decimal place)?a. 14.9b. 19.8c. 17.3d. 18.4Computron's Balance Sheets (Millions of Dollars) 2019 2020 Assets Cash and equivalents $ 60 $ 50 Short-term investments 100 10 Accounts receivable 400 520 Inventories 620 820 Total current assets $ 1,180 $ 1,400 Gross fixed assets $ 3,900 $ 4,820 Less: Accumulated depreciation 1,000 1,320 Net fixed assets $ 2,900 $ 3,500 Total assets $ 4,080 $ 4,900 Liabilities and equity Accounts payable $ 300 $ 400 Notes payable 50 250 Accruals 200 240 Total current liabilities $ 550 $ 890 Long-term bonds 800 1,100 Total liabilities $ 1,350 $ 1,990 Common stock 1,000 1,000 Retained earnings 1,730 1,910 Total equity $ 2,730 $ 2,910 Total liabilities and equity $ 4,080 $ 4,900 Computron's Income Statement (Millions of Dollars) 2019 2020 Net sales $ 5,500 $ 6,000 Cost of goods sold (Excluding depr. & amort.) 4,300 4,800 Depreciation and amortizationa 290 320 Other operating expenses 350 420 Total operating…
- Computron's Balance Sheets (Millions of Dollars) 2019 2020 Assets Cash and equivalents $ 60 $ 50 Short-term investments 100 10 Accounts receivable 400 520 Inventories 620 820 Total current assets $ 1,180 $ 1,400 Gross fixed assets $ 3,900 $ 4,820 Less: Accumulated depreciation 1,000 1,320 Net fixed assets $ 2,900 $ 3,500 Total assets $ 4,080 $ 4,900 Liabilities and equity Accounts payable $ 300 $ 400 Notes payable 50 250 Accruals 200 240 Total current liabilities $ 550 $ 890 Long-term bonds 800 1,100 Total liabilities $ 1,350 $ 1,990 Common stock 1,000 1,000 Retained earnings 1,730 1,910 Total equity $ 2,730 $ 2,910 Total liabilities and equity $ 4,080 $ 4,900 Computron's Income Statement (Millions of Dollars) 2019 2020 Net sales $ 5,500 $ 6,000 Cost of goods sold (Excluding depr. & amort.) 4,300 4,800 Depreciation and amortizationa 290 320 Other operating expenses 350 420 Total operating…SME Balance Sheet 2021 2020 Assets (in millions) Cash 85.960 56.460 Receivables 89.560 80.670 Inventories 55.750 41.260 Other Current Assets 9.950 6.760 Total Current Assets 241.220 185.150 Net Property, Plant, and Equipment 78.970 68.930 Goodwill and Other Intangible Assets 103.110 104.360 Other Non-Current Assets 6.900 4.200 Total Assets 430.200 362.640 Total Liabilities and Shareholders' Equity Payables 83.240 57.48 Current Debt 2.700 2.64 Total Current Liabilities 85.940 60.120 Long-Term Debt 122.000 119.62 Other Liabilities 21.880 22.58 Total Liabilities 229.820 202.320 Common Stock 200.380 160.32 Total Equity 200.38 160.32 Total Liabilities and Equity 430.200 362.640 INCOME STATEMENT 2021 Total Revenue (M) 488.10…SME Balance Sheet 2021 2020 Assets (in millions) Cash 85.960 56.460 Receivables 89.560 80.670 Inventories 55.750 41.260 Other Current Assets 9.950 6.760 Total Current Assets 241.220 185.150 Net Property, Plant, and Equipment 78.970 68.930 Goodwill and Other Intangible Assets 103.110 104.360 Other Non-Current Assets 6.900 4.200 Total Assets 430.200 362.640 Total Liabilities and Shareholders' Equity Payables 83.240 57.48 Current Debt 2.700 2.64 Total Current Liabilities 85.940 60.120 Long-Term Debt 122.000 119.62 Other Liabilities 21.880 22.58 Total Liabilities 229.820 202.320 Common Stock 200.380 160.32 Total Equity 200.38 160.32 Total Liabilities and Equity 430.200 362.640 INCOME STATEMENT 2021 Total Revenue (M) 488.10…
- SME Balance Sheet 2021 2020 Assets (in millions) Cash 85.960 56.460 Receivables 89.560 80.670 Inventories 55.750 41.260 Other Current Assets 9.950 6.760 Total Current Assets 241.220 185.150 Net Property, Plant, and Equipment 78.970 68.930 Goodwill and Other Intangible Assets 103.110 104.360 Other Non-Current Assets 6.900 4.200 Total Assets 430.200 362.640 Total Liabilities and Shareholders' Equity Payables 83.240 57.48 Current Debt 2.700 2.64 Total Current Liabilities 85.940 60.120 Long-Term Debt 122.000 119.62 Other Liabilities 21.880 22.58 Total Liabilities 229.820 202.320 Common Stock 200.380 160.32 Total Equity 200.38 160.32 Total Liabilities and Equity 430.200 362.640 INCOME STATEMENT 2021 Total Revenue (M) 488.10…SME Balance Sheet 2021 2020 Assets (in millions) Cash 85.960 56.460 Receivables 89.560 80.670 Inventories 55.750 41.260 Other Current Assets 9.950 6.760 Total Current Assets 241.220 185.150 Net Property, Plant, and Equipment 78.970 68.930 Goodwill and Other Intangible Assets 103.110 104.360 Other Non-Current Assets 6.900 4.200 Total Assets 430.200 362.640 Total Liabilities and Shareholders' Equity Payables 83.240 57.48 Current Debt 2.700 2.64 Total Current Liabilities 85.940 60.120 Long-Term Debt 122.000 119.62 Other Liabilities 21.880 22.58 Total Liabilities 229.820 202.320 Common Stock 200.380 160.32 Total Equity 200.38 160.32 Total Liabilities and Equity 430.200 362.640 INCOME STATEMENT 2021 Total Revenue (M) 488.10…SME Balance Sheet 2021 2020 Assets (in millions) Cash 85.960 56.460 Receivables 89.560 80.670 Inventories 55.750 41.260 Other Current Assets 9.950 6.760 Total Current Assets 241.220 185.150 Net Property, Plant, and Equipment 78.970 68.930 Goodwill and Other Intangible Assets 103.110 104.360 Other Non-Current Assets 6.900 4.200 Total Assets 430.200 362.640 Total Liabilities and Shareholders' Equity Payables 83.240 57.48 Current Debt 2.700 2.64 Total Current Liabilities 85.940 60.120 Long-Term Debt 122.000 119.62 Other Liabilities 21.880 22.58 Total Liabilities 229.820 202.320 Common Stock 200.380 160.32 Total Equity 200.38 160.32 Total Liabilities and Equity 430.200 362.640 INCOME STATEMENT 2021 Total Revenue (M) 488.10…

